
Market Overview
Market Overview is the perfect feature to quickly understand how different groups of traders are positioned across the market, giving you a bird’s-eye view of overall sentiment through a heatmap instead of analyzing individual wallets.
How to use this feature?
To start, click here (Market Overview) or go to ‘Birdeye.so’ → ‘Perps’.
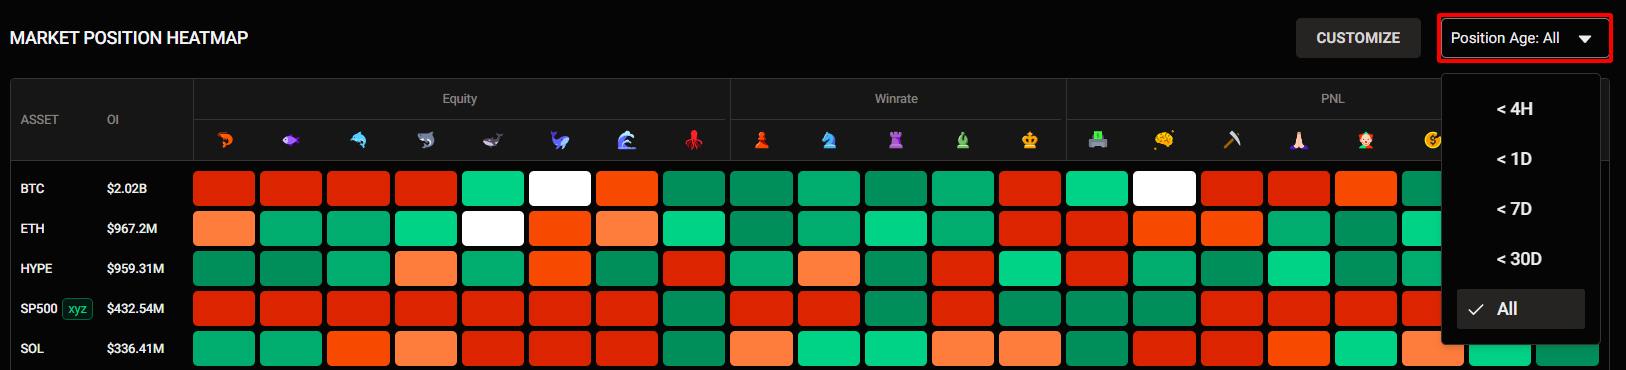
The starting point of our analysis is the Market Position Heatmap.
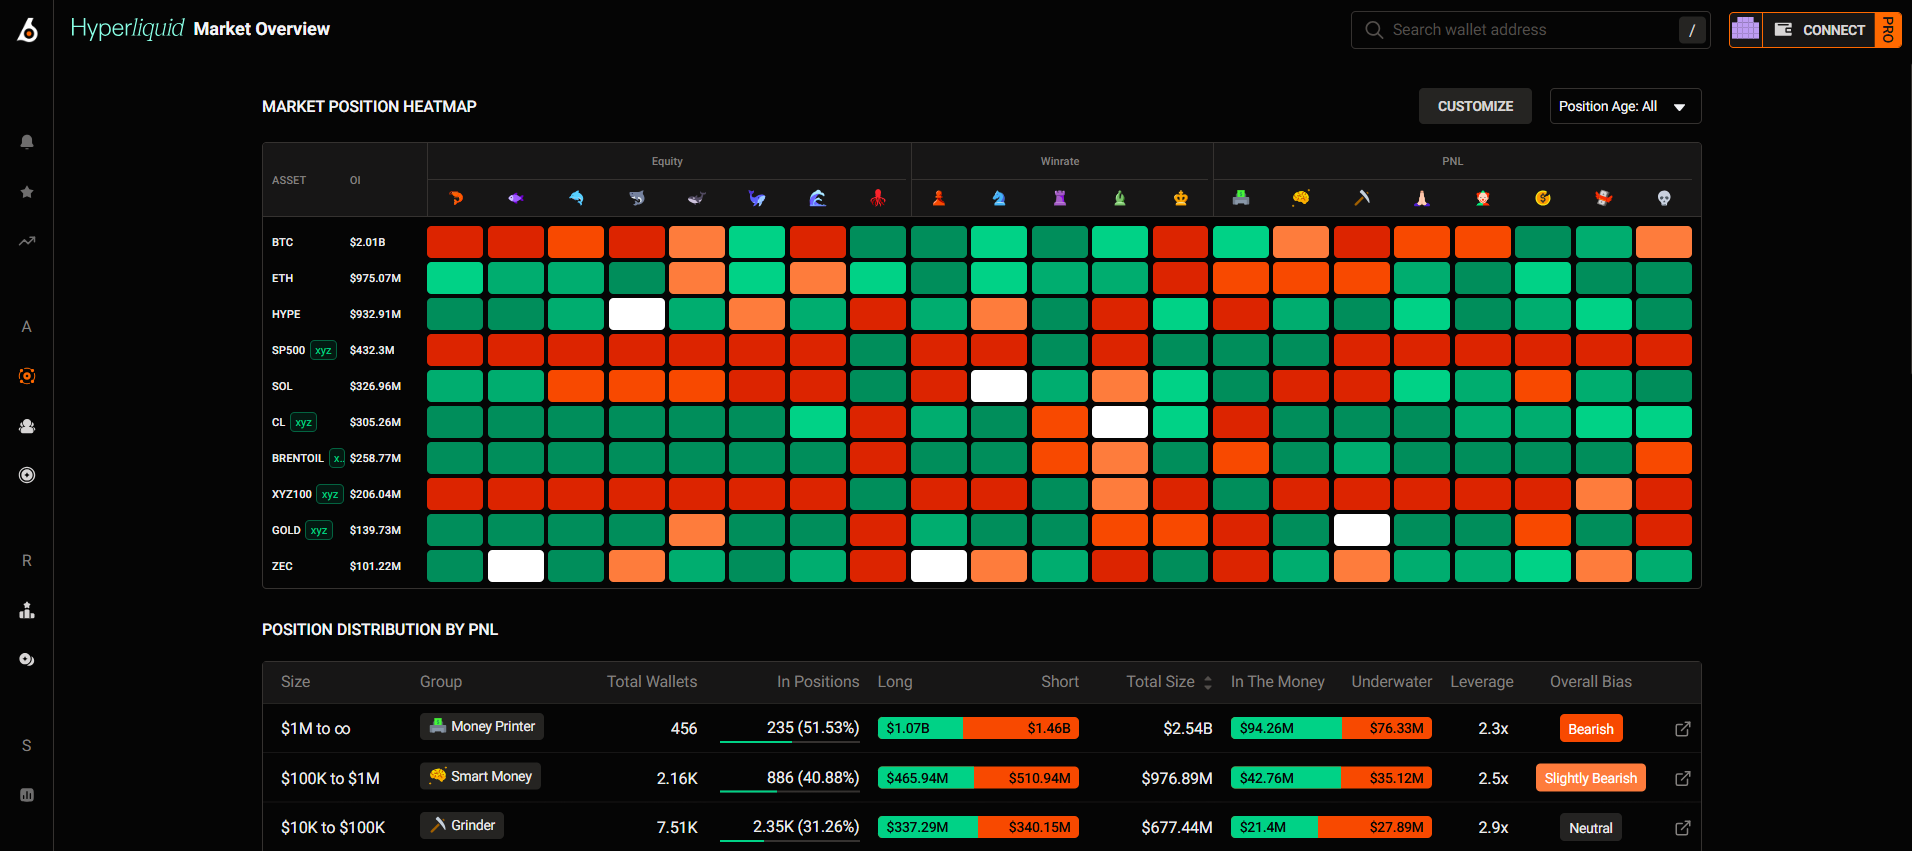
Market Position Heatmap
To understand this heatmap effectively, there are 2 key things you need to know:
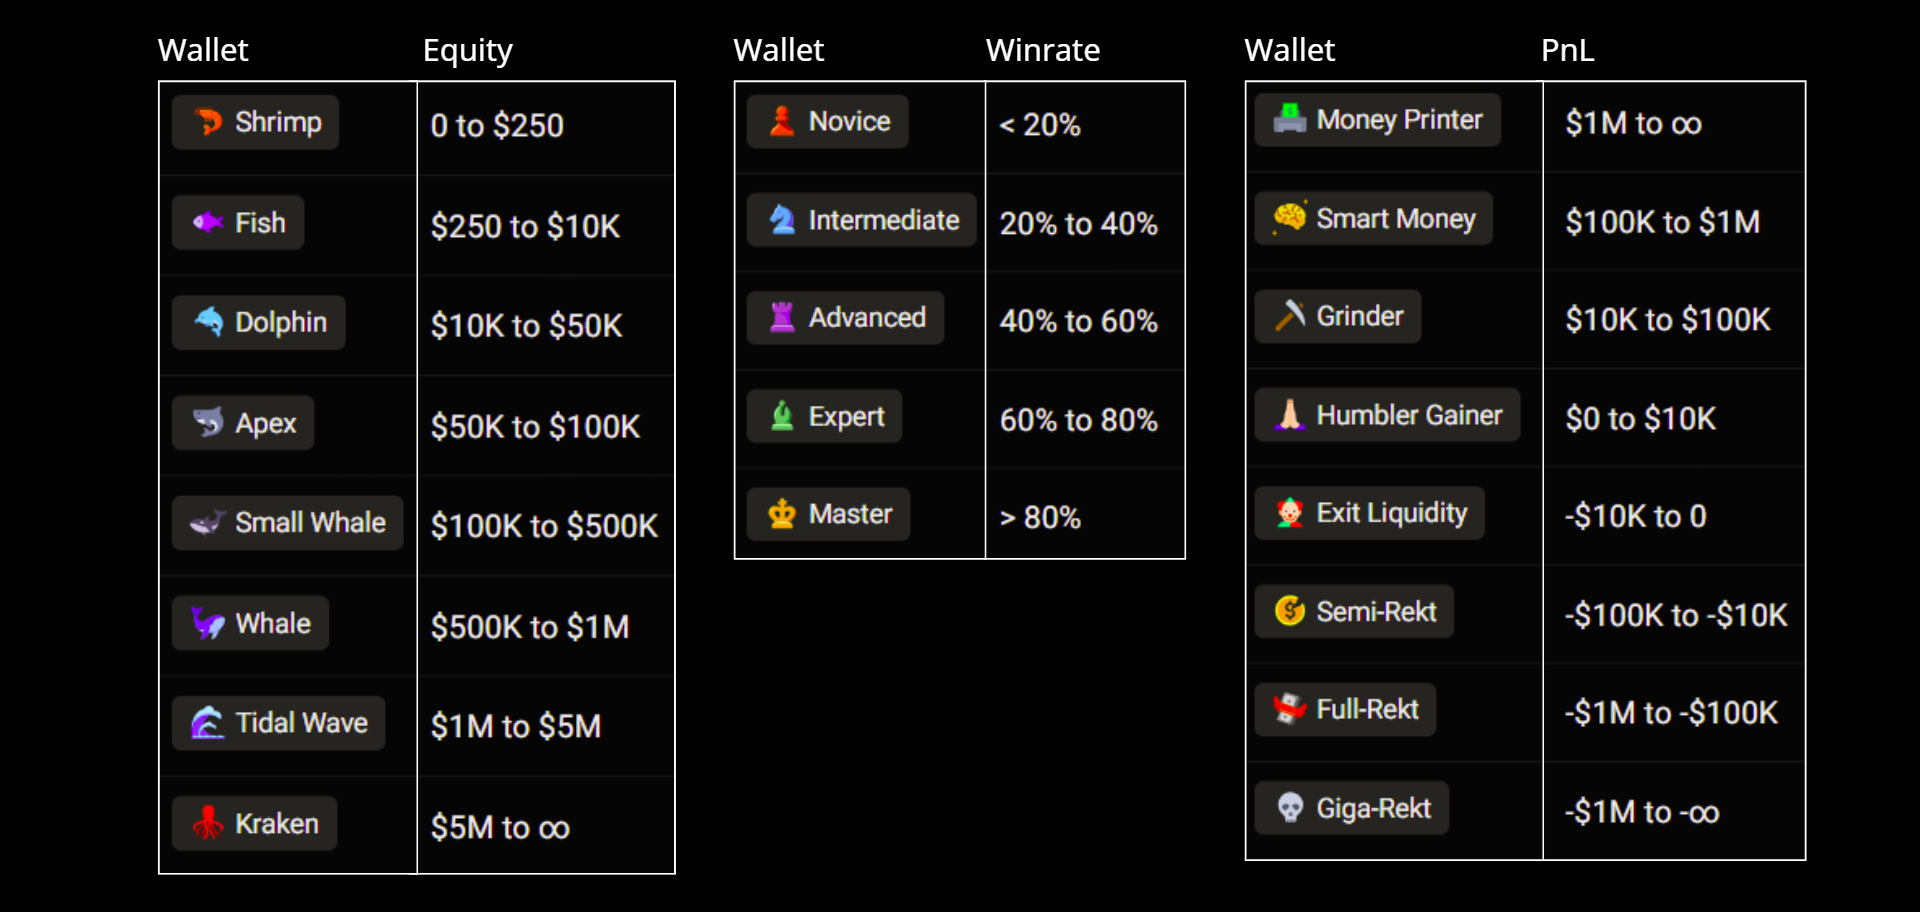
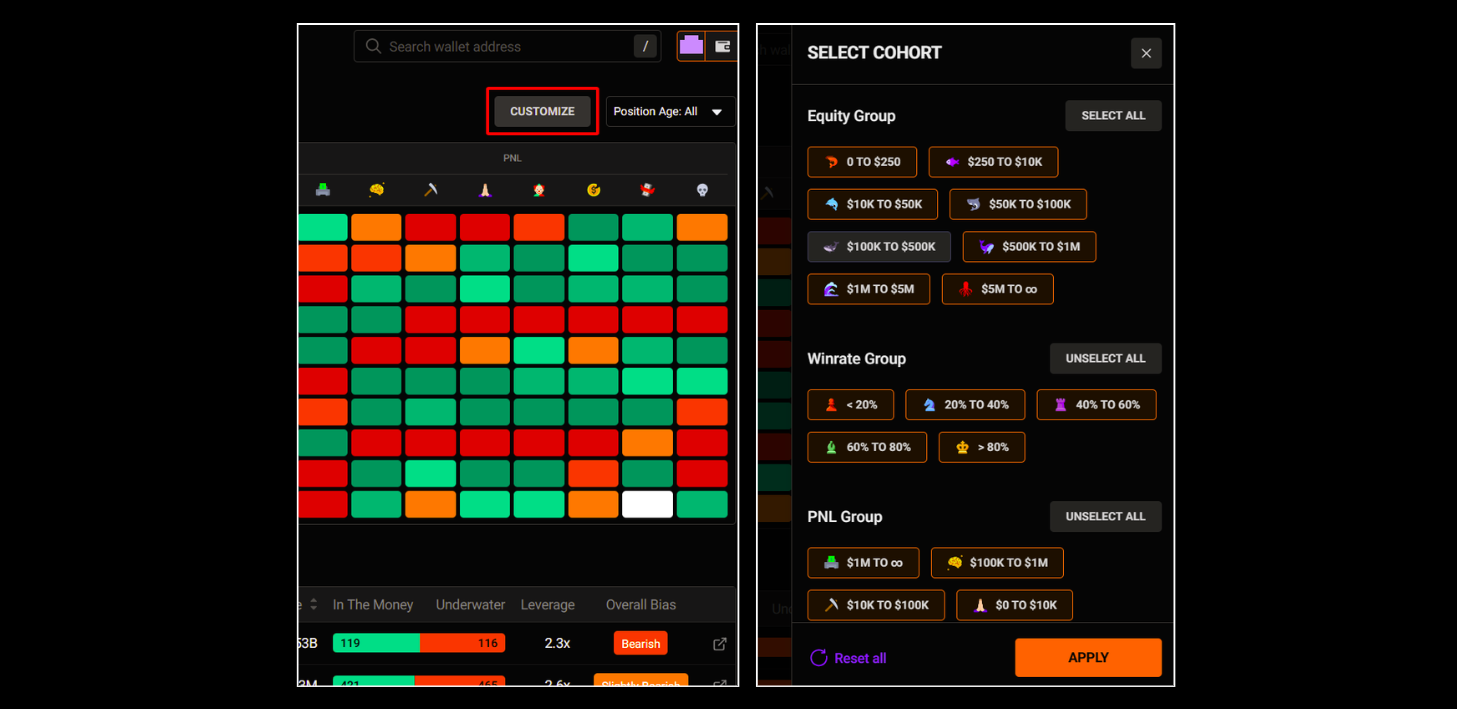
[1] Understand the Icons (Trader Groups)
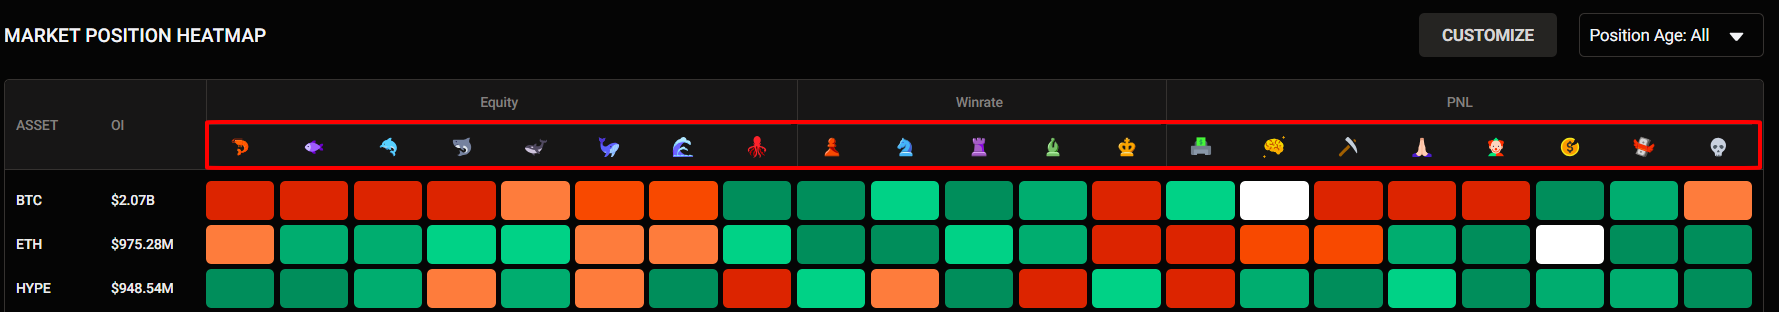
Each icon represents a specific cohort of traders, categorized based on:
- Equity (capital size)
- Winrate
- PnL performance
In simple terms: Each icon = a type of trader
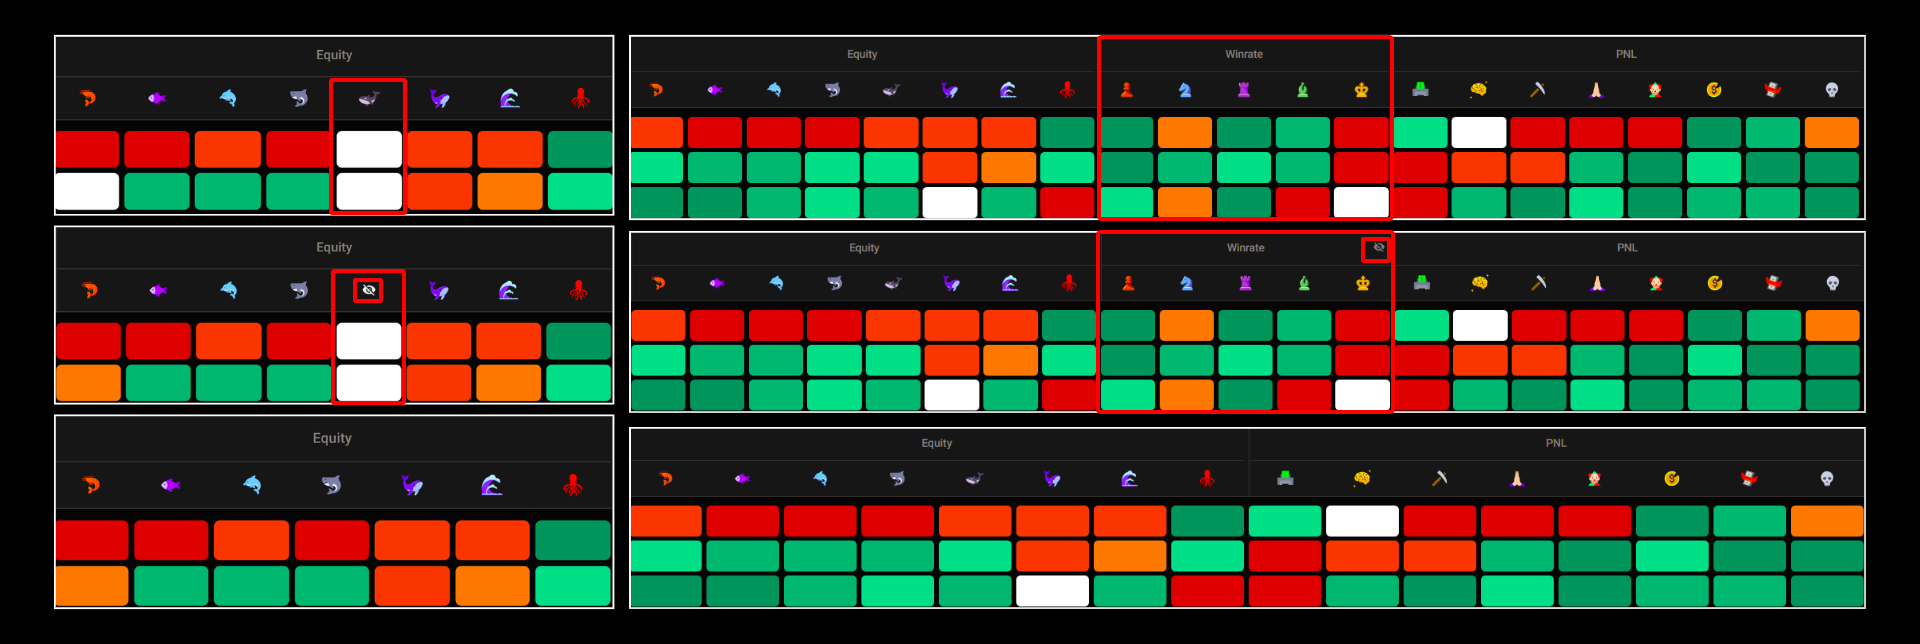
[2] Understand the Heatmap Colors
- 🟢 Green: Long positions > Short positions
- ⚪ White: Long positions = Short positions
- 🔴 Red: Long positions < Short positions
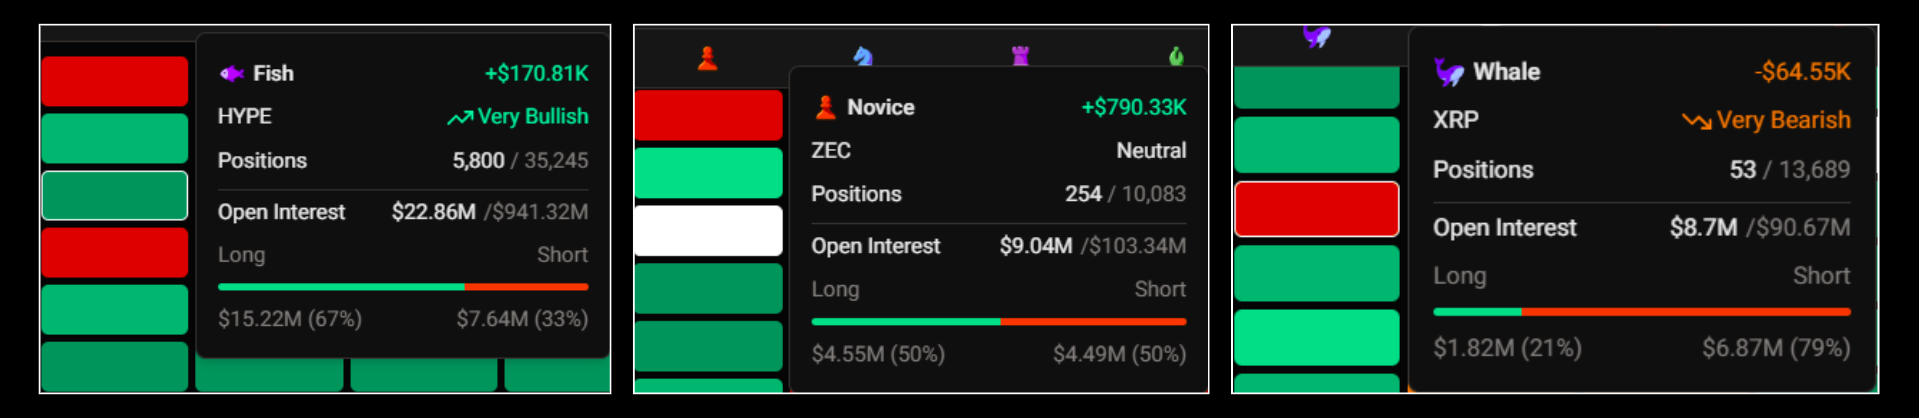
Here, you can hover over each cell to see detailed data or click into a token to explore deeper insights.
Tip for you:
You can hide a group trader by click on this icon or this group.
Or you can click to Customize and select all cohorts you want.
For more: You can use select Position age (<4H, <1D, <7D, <30D, or All) to easy analyze the market.
Position Distribution by cohort (Group of traders)
Position Distribution helps you understand how different groups of traders are positioned based on:
- PnL (profit/loss)
- Equity (capital size)
- Winrate (skill level)
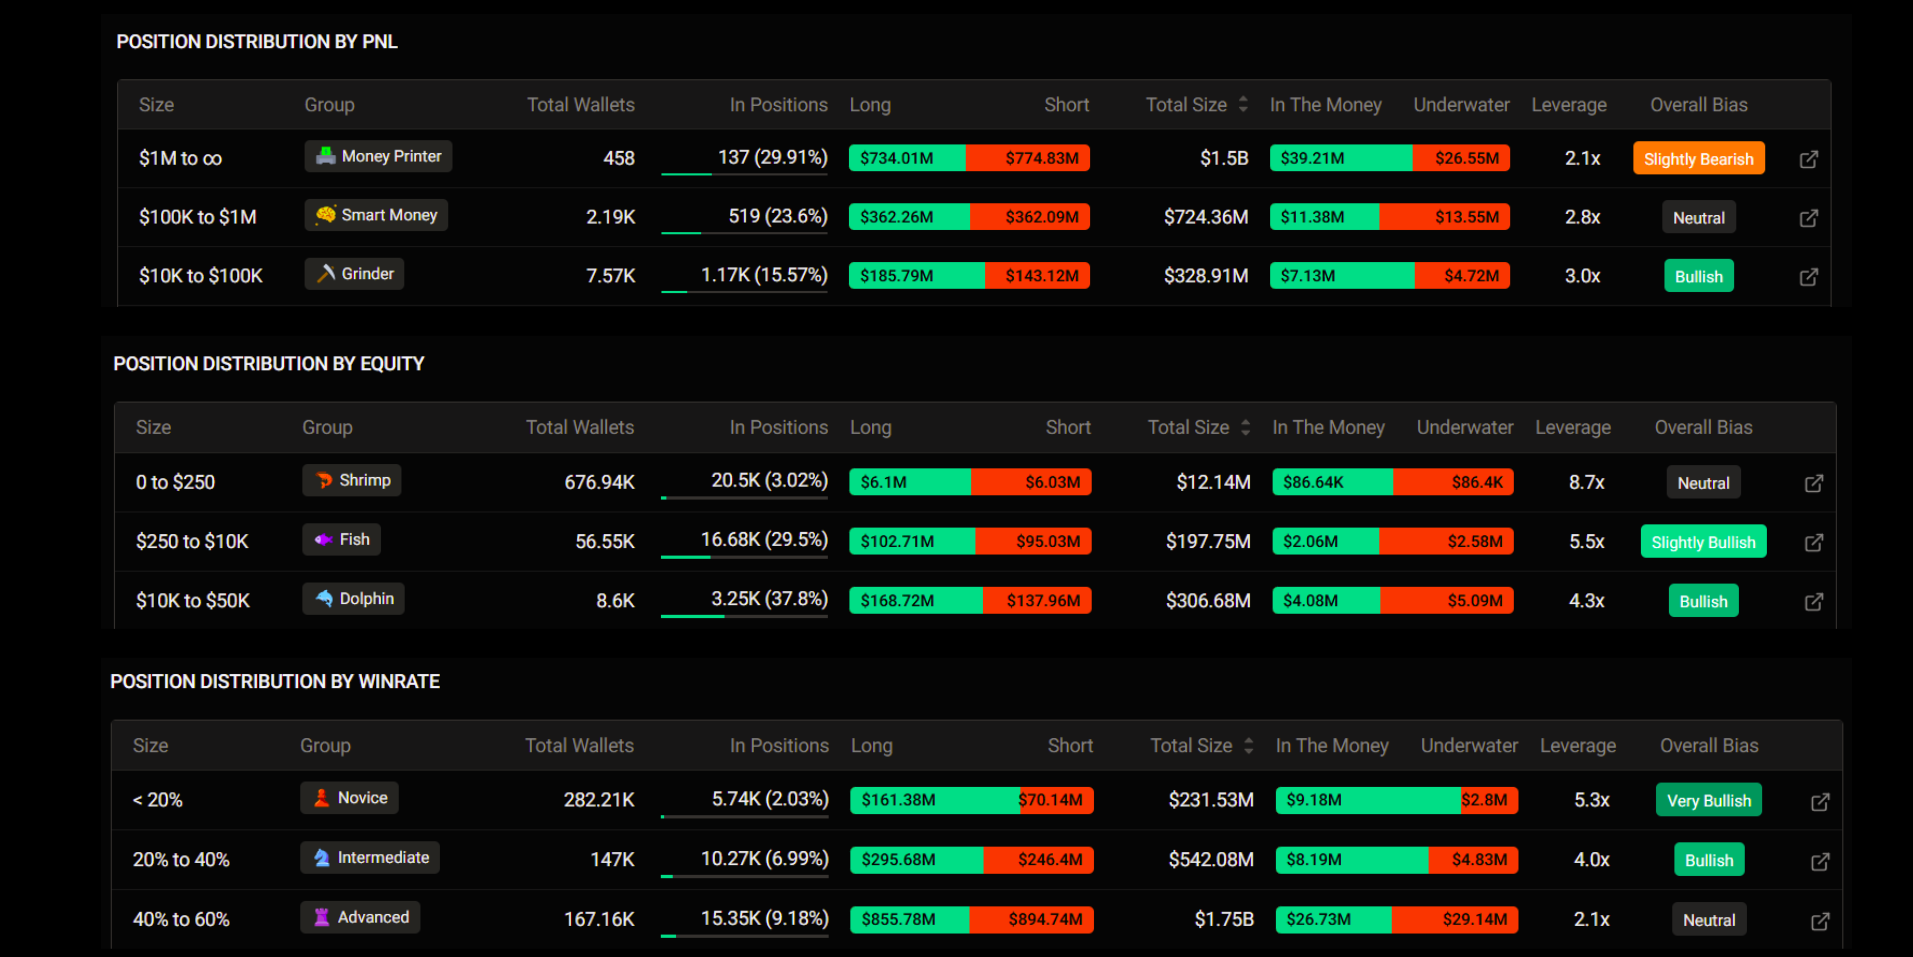
This is where you see what different trader groups are actually doing with their money. In particular, you can track each group's real-time activity: how many are in positions, their Long vs. Short volume, their overall bias and more.
Key metrics explained (applies to all tables):
- Total Wallets: Number of wallets in the group
- In Positions: % of wallets currently holding positions
- Long / Short: Total value of long vs short positions
- Total Size: Total capital deployed
- In The Money: Positions currently in profit
- Underwater: Positions currently at a loss
- Leverage: Average leverage used
- Overall Bias: Net market direction (Bullish / Bearish / Neutral)
You’ll need:
Updated about 2 months ago