
How to read the Wallet Analyzer (Solana wallet)
Understand a trader's entire activity at a glance.
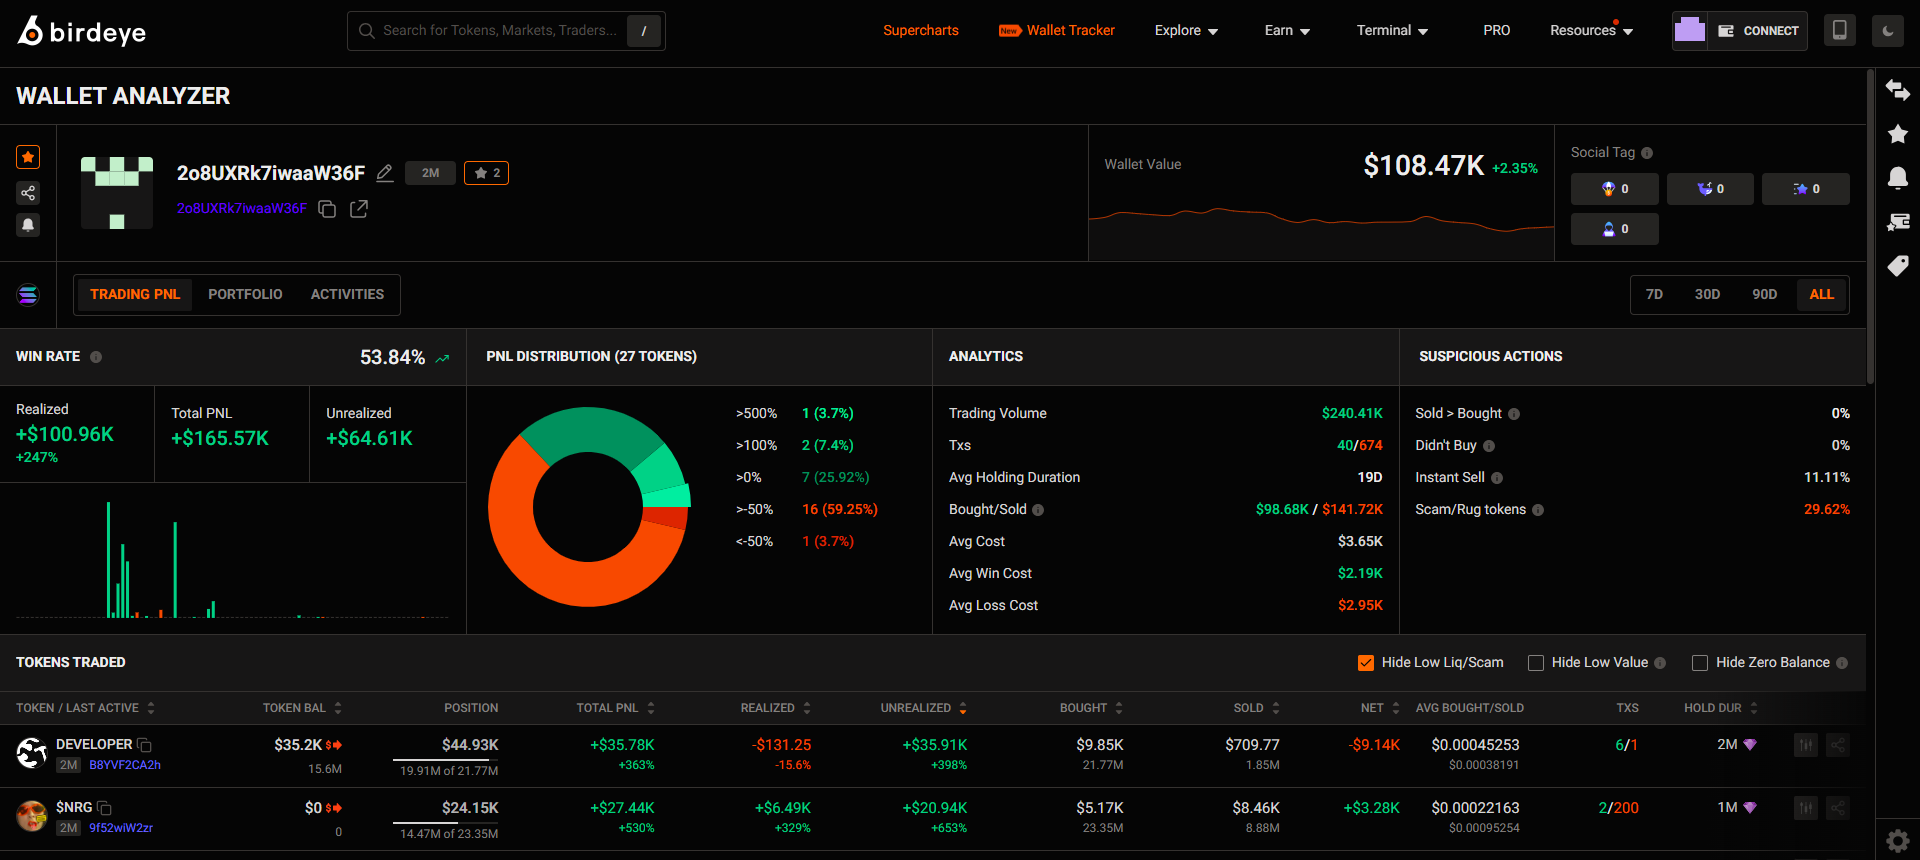
The Wallet Analyzer detail page gives you a complete view of a trader’s activity, performance, and trading style. By understanding this page, you can quickly evaluate whether a trader is worth following, learn from their strategies, or spot potential opportunities.
Here are the things you need to know when using this feature.
Trading PnL tab - Quickly Spot Trader Performance
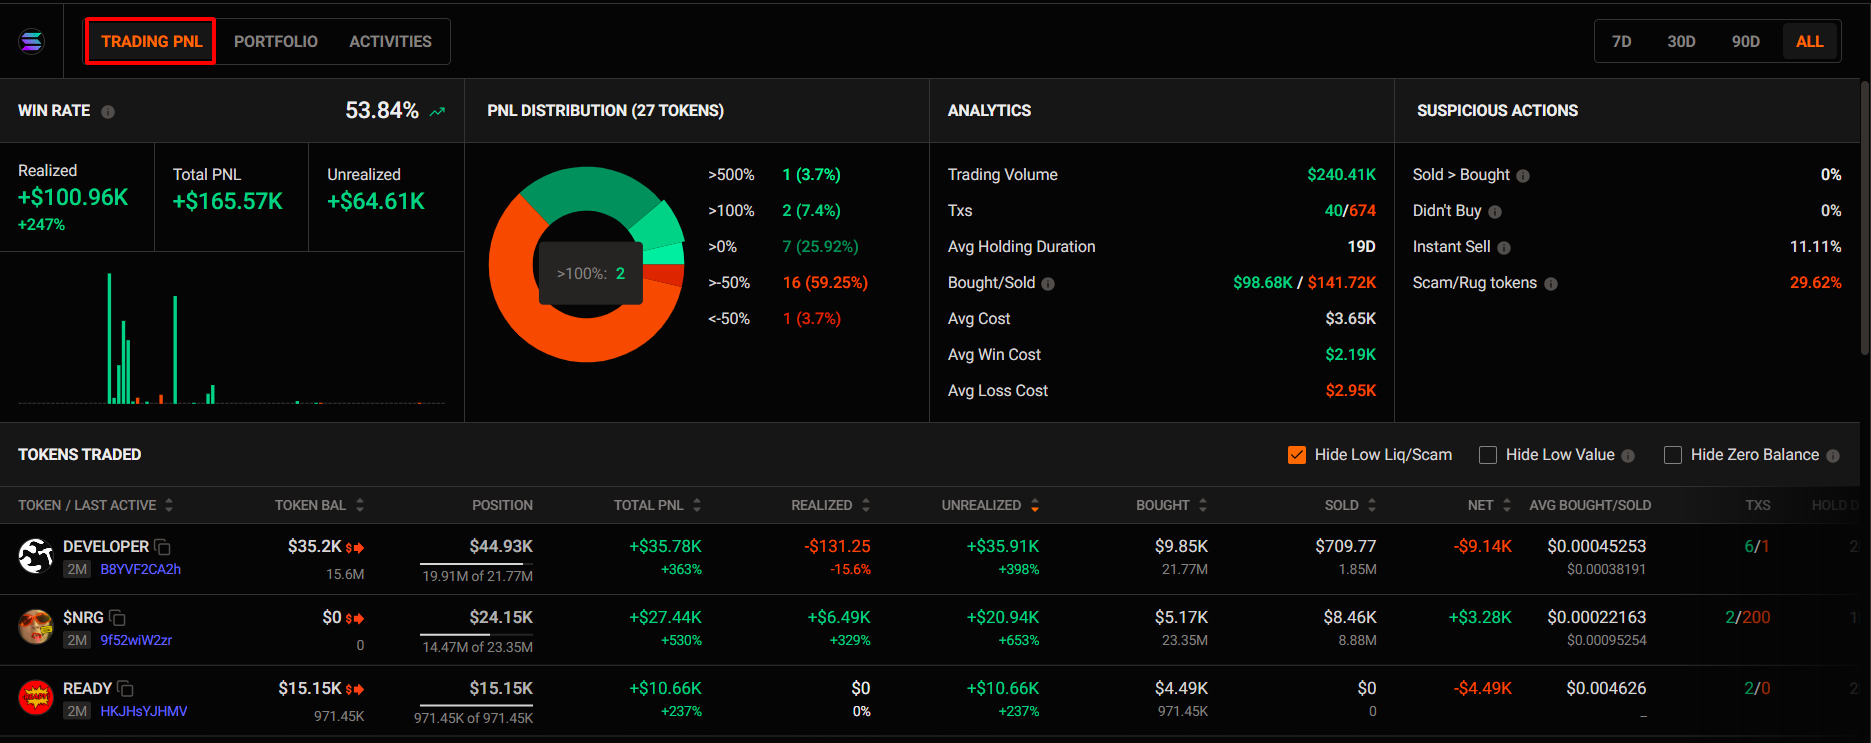
Here, you should focus on two things:
- Wallet performance analysis
- Token trading analysis
Wallet performance analysis
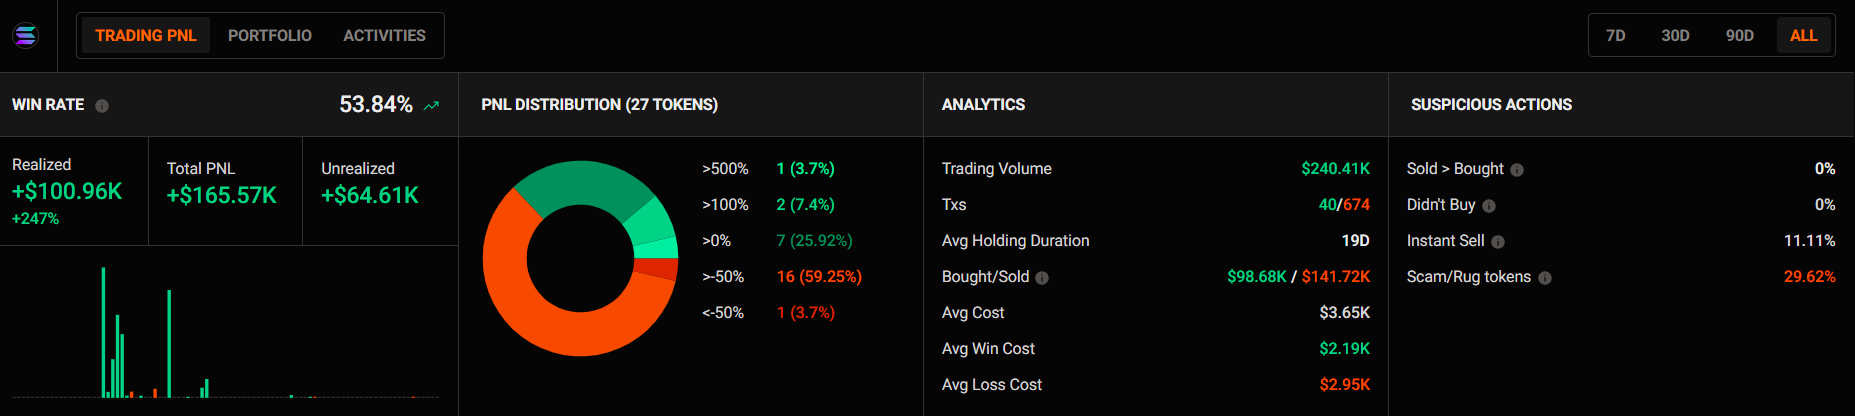
Here, you’ll get a clear picture of:
- Understand the wallet’s real profitability, not just surface-level gains or losses.
- PnL Distribution Overview: See how many tokens are in profit or at a loss and their weight in the overall portfolio.
- Trading Behavior Insights: Quickly identify the trader’s style and the quality of their executions.
- Suspicious Actions: Spot wallets with risky patterns or potential scam behavior before it’s too late.
Special: You can view this data in multiple timeframes (7D, 30D, 90D, ALL)
Token trading analysis
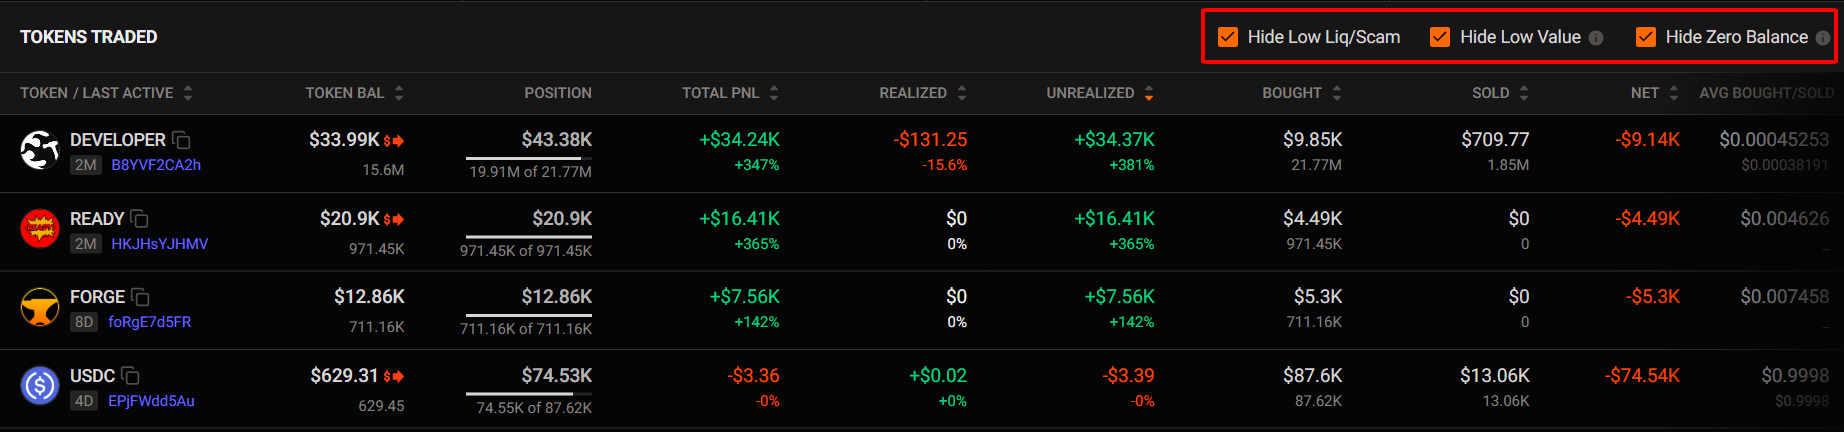
Here, you can see:
- Detailed profit and position status for each token
- Holding duration
- Average buy/sell prices, and more
This helps you assess the trader’s skill, timing, and overall trading competence.
💡Tip for you: Turn on Hide low liq/Scam, Low value, and Zero Balance to filter out low-quality tokens or positions with high risk.
When you click on a specific token, you’ll see:
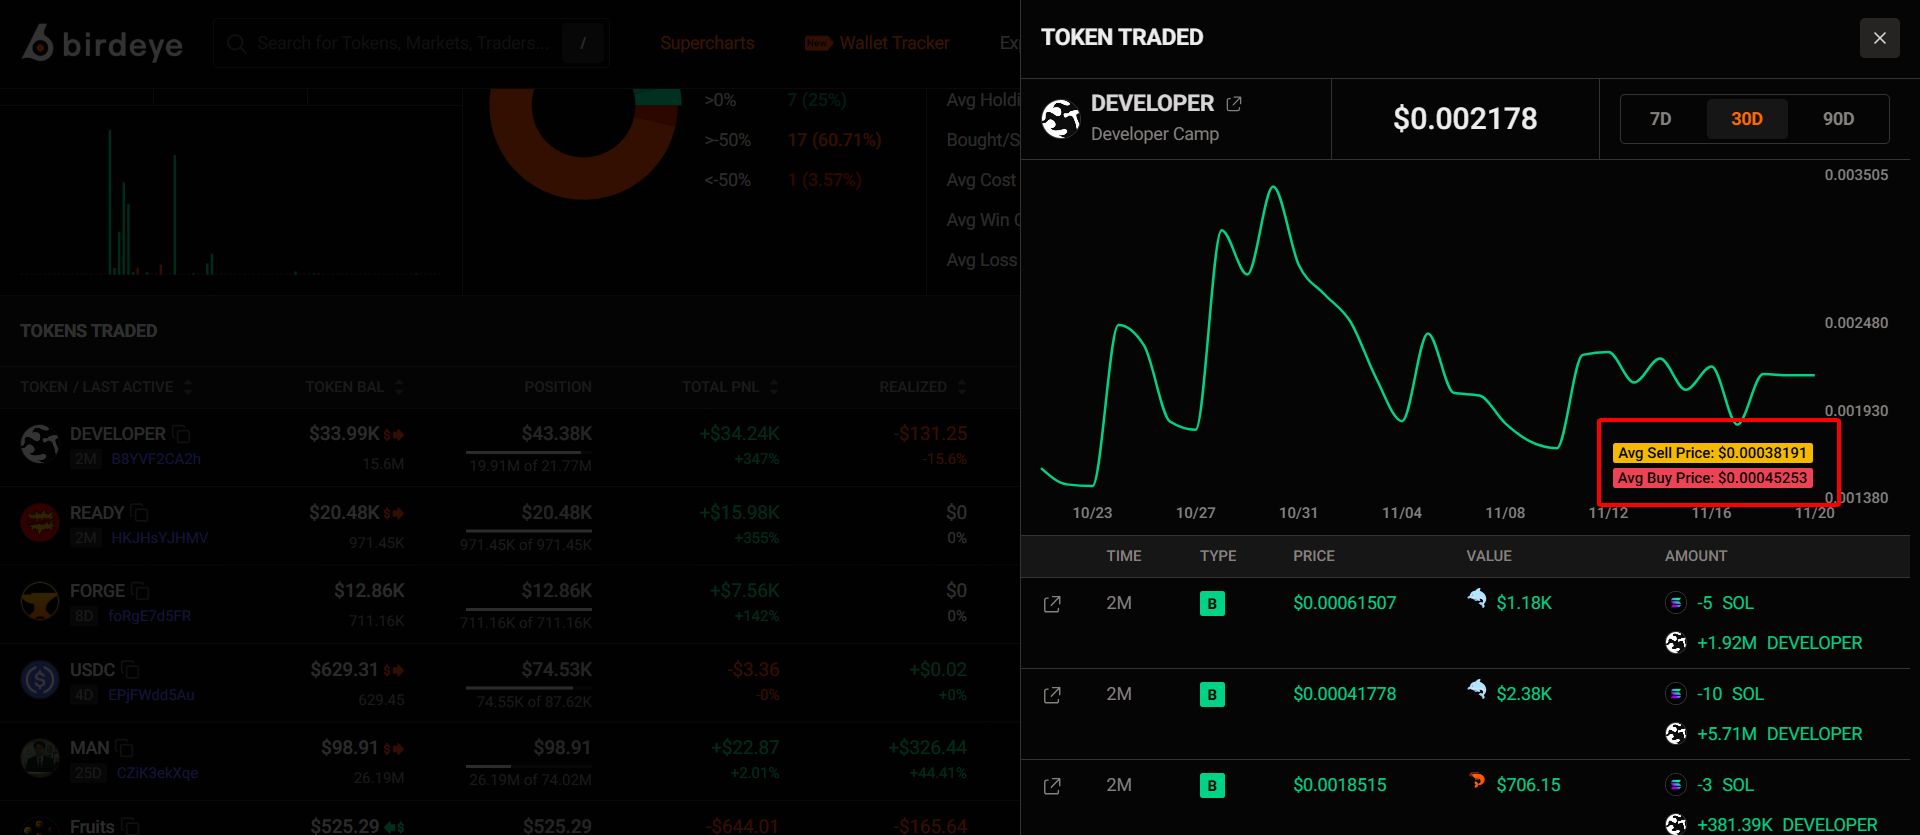
You’ll see:
- Most recent trade time
- Trade type (Buy/Sell)
- Trade value and average buy/sell price across different timeframes
❗ Explanation of key metrics
[1] Tranfer
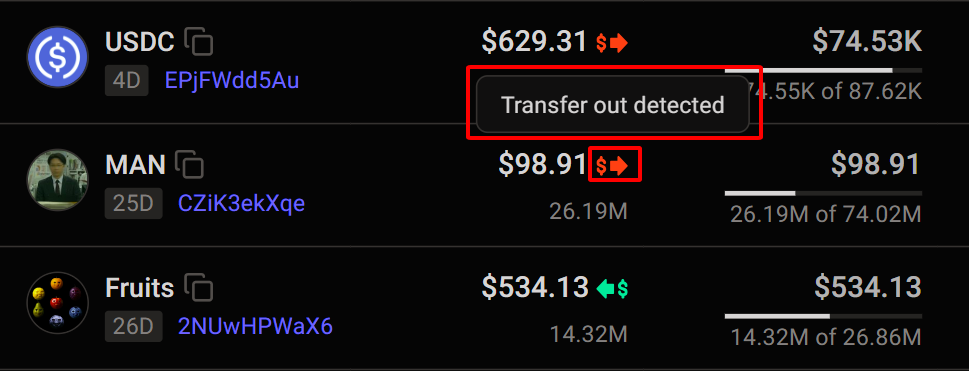
- Red $ (Transfer out): A portion of tokens transferred out of the wallet
- Green $ (Transfer in): A portion of tokens transferred into the wallet
[2] Position
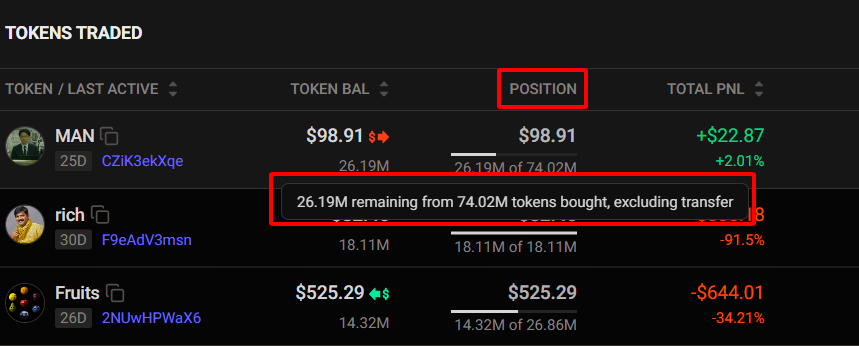
Position: Shows the position size based on net buys and sells, excluding transfers.
[3] TXS
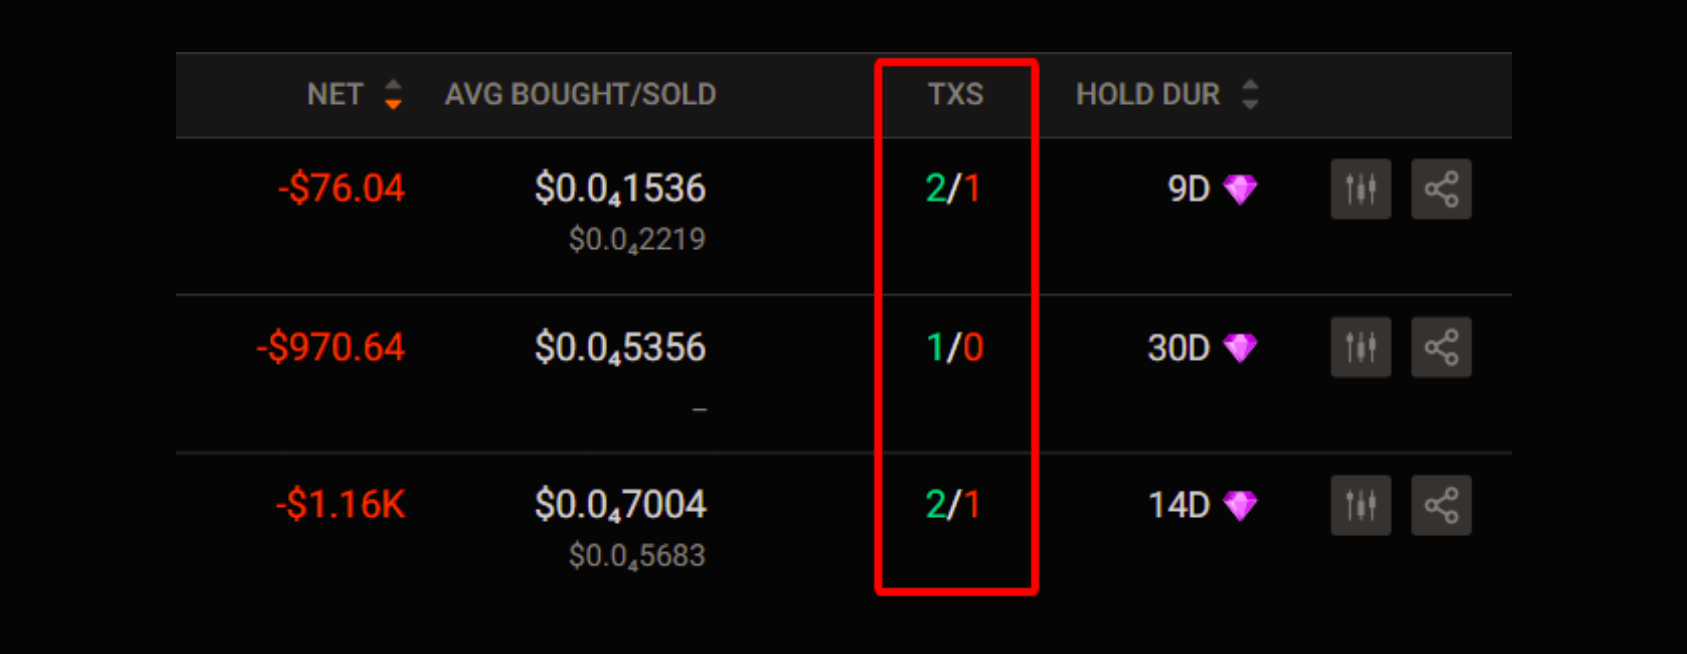
TXS: Indicates how many times the trader has bought or sold that token.
Portfolio tab - Find Hidden Gems Before the Crowd
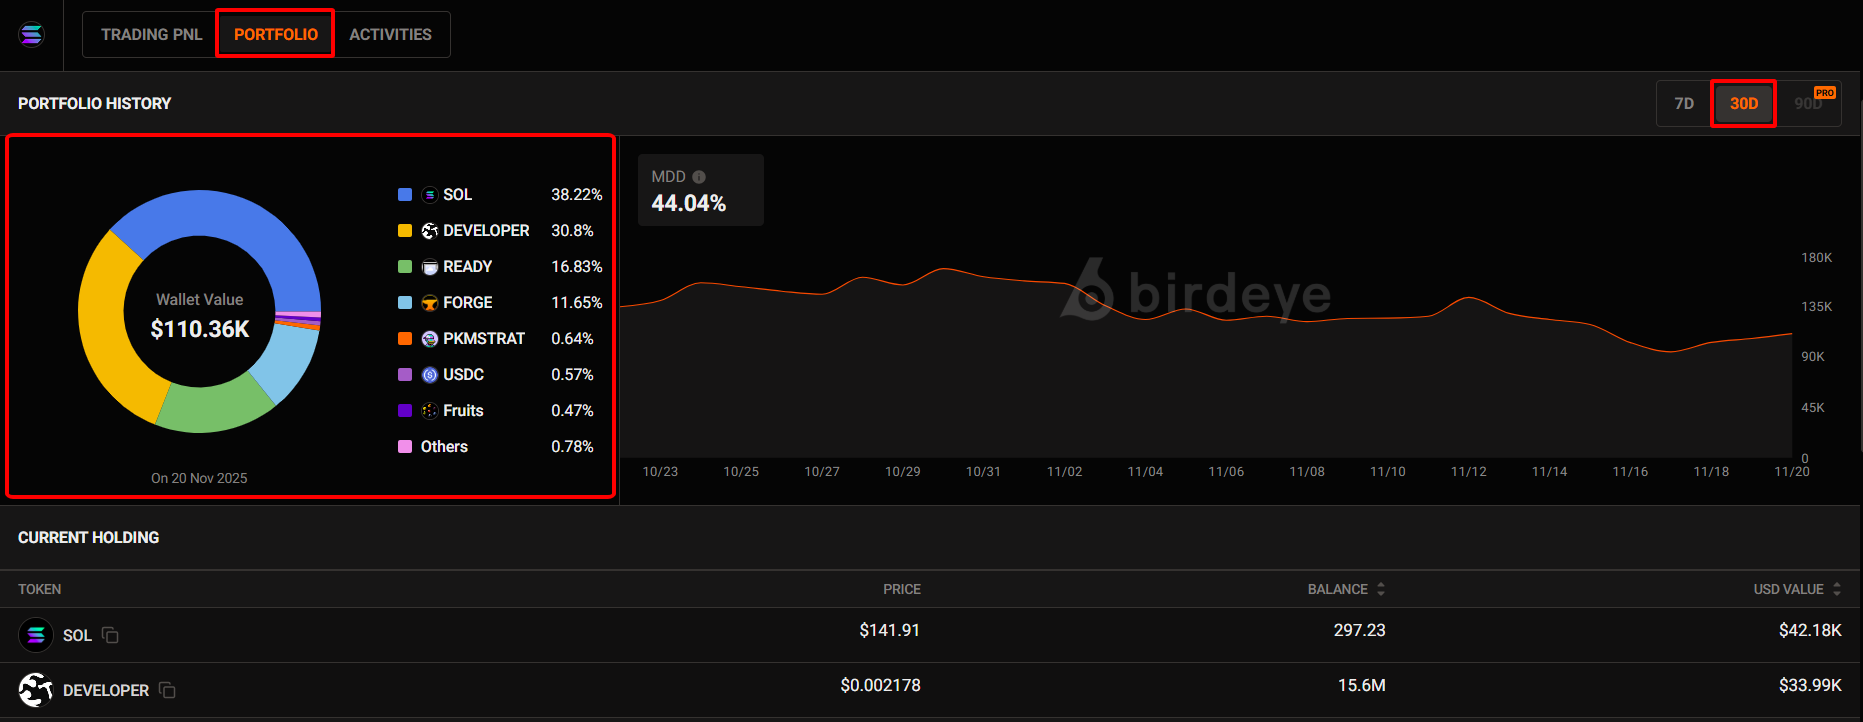
At this section, you can quickly assess the trader’s conviction and the overall quality of their portfolio.
Specifically, you’ll see:
- Total wallet value
- How the trader allocates their portfolio
- Which tokens they are currently holding
- MDD (Max drawdown): The maximum percentage decline from the wallet’s peak value to its lowest point, reflecting the trader’s worst historical loss and risk exposure.
If you believe this trader has strong performance or good strategy, their current holdings can serve as a starting point for your own investment ideas.
Trading Activities tab - Make Faster Copy-Trading Decisions
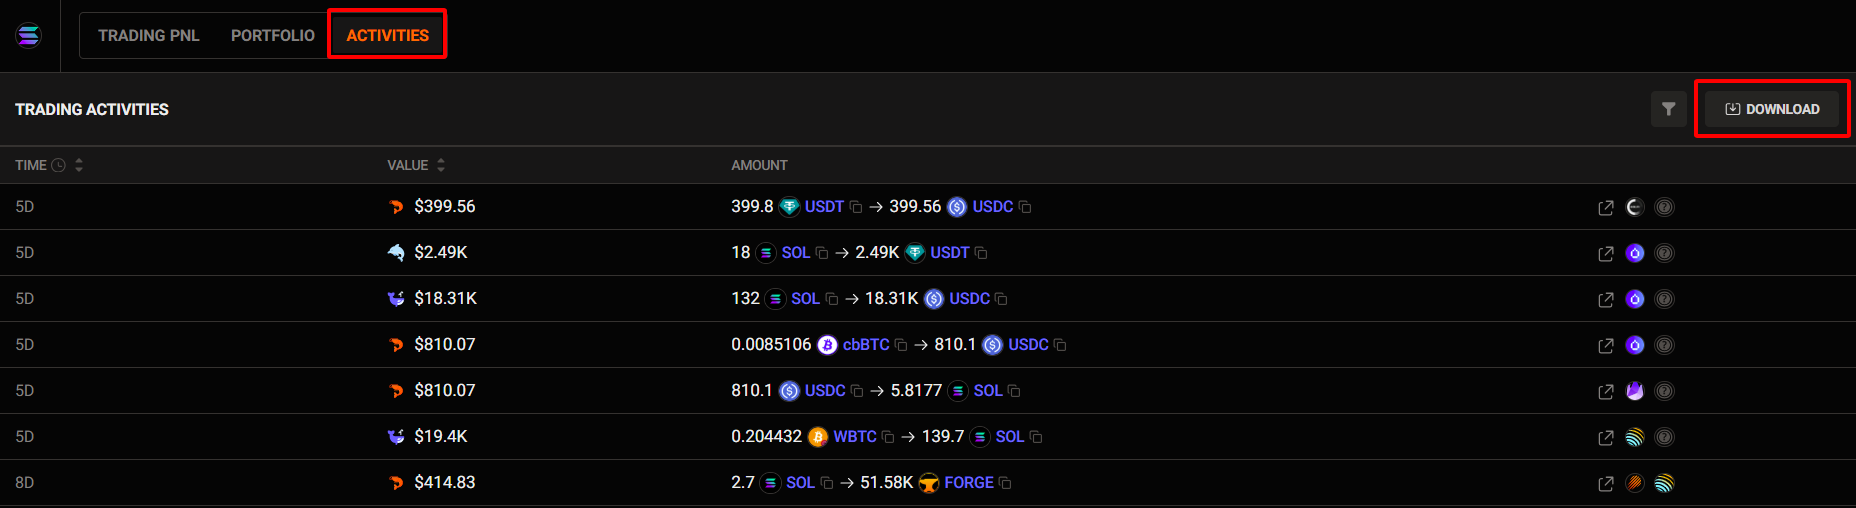
In this section, you can track every action the trader makes in real time.
This helps you quickly understand what they’re buying, selling, rotating, or exiting.
You’ll see:
- Timestamp of each trade
- Value of every transaction
- Exact amounts of tokens bought or sold
There’s also a Download button, allowing you to export the full activity history for deeper analysis or to compare across multiple wallets.
Unlock more with Pro
| PRO Features | FREE Users | PRO Users |
|---|---|---|
Download Data as CSV
| ❌ | ✅ Up to 100 files/month |
| Maximum Drawdown (MDD) chart | 30D | 90D |
Updated about 2 months ago