
How to analyze the market
By keeping up with market trends, you can avoid riding the waves that have already passed and get ahead of the new ones.
Insight is powerful tool that help you track money flow, identify potential trends, and make data-driven decisions instead of emotional ones.
Here are two steps to help you analyze the market more easily.
Step 1: Start with the Big Picture
To start, click here (Insight) or go to ‘Explore’ ⇒ ‘Insight'.
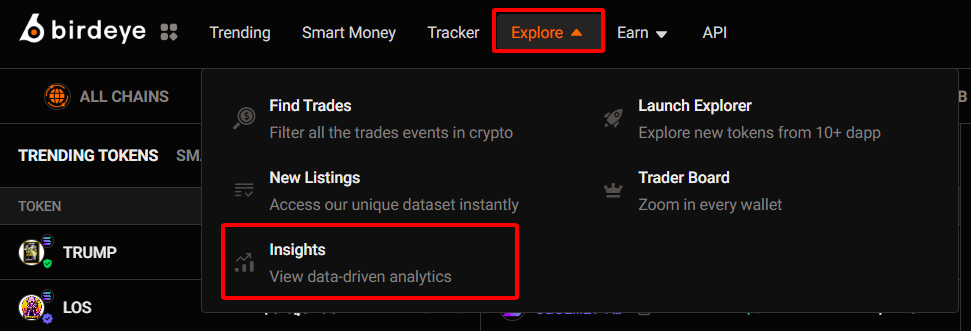
Here you'll find comprehensive market charts.
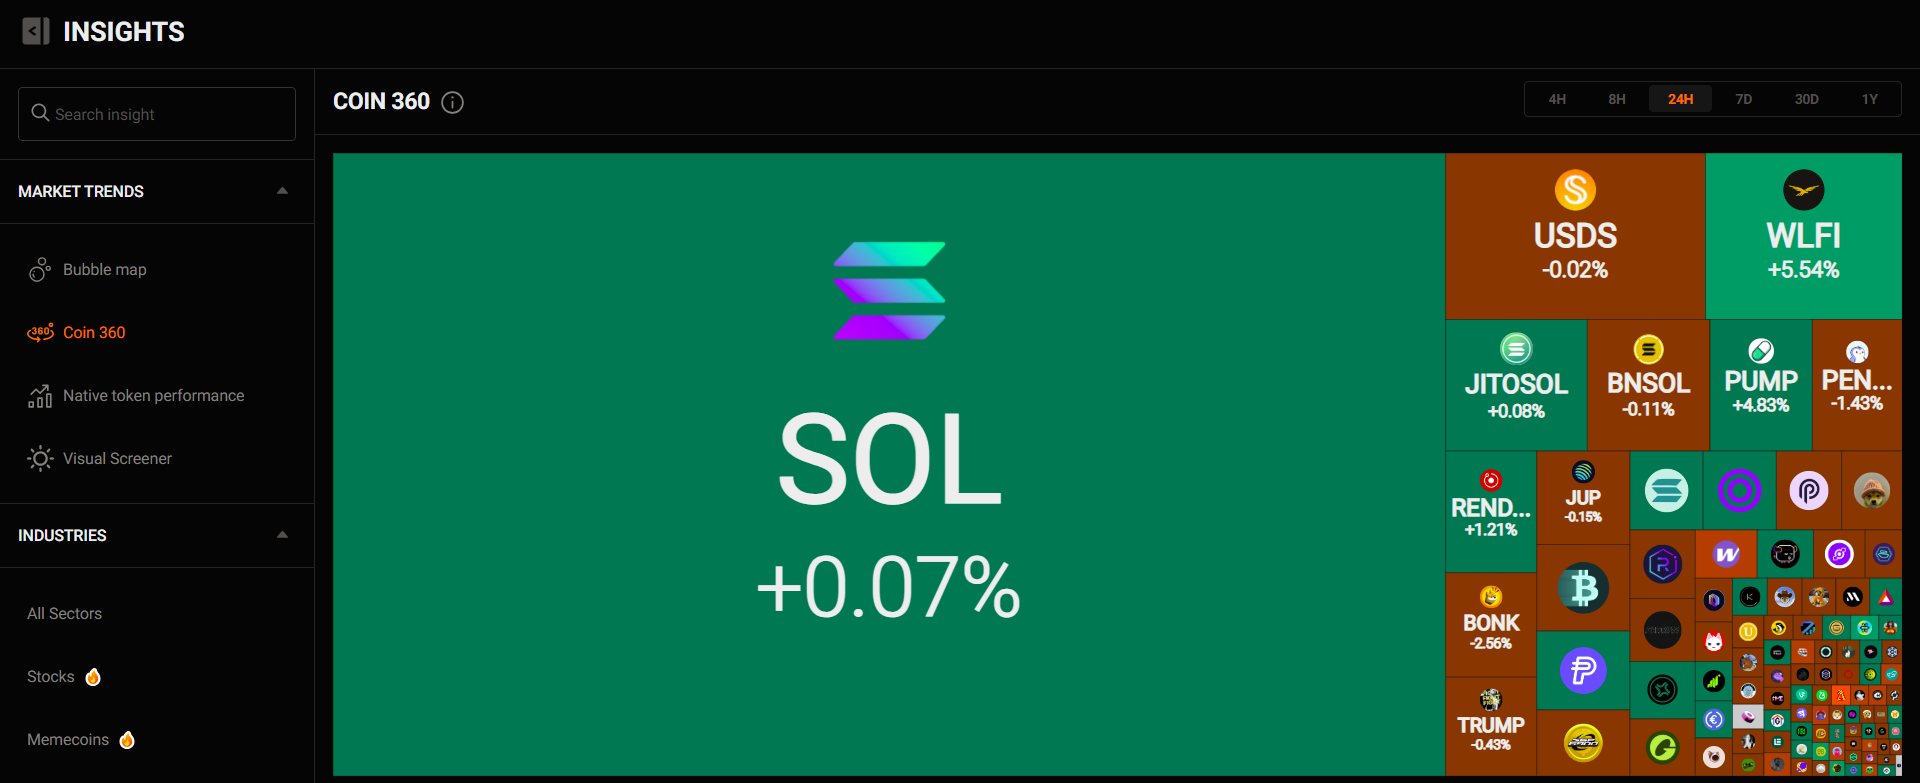
[1] Coin 360
The Coin360 chart provides an overview of the entire crypto market across various timeframes, with color-coded price changes, while the size of each block reflects a token’s market capitalization.
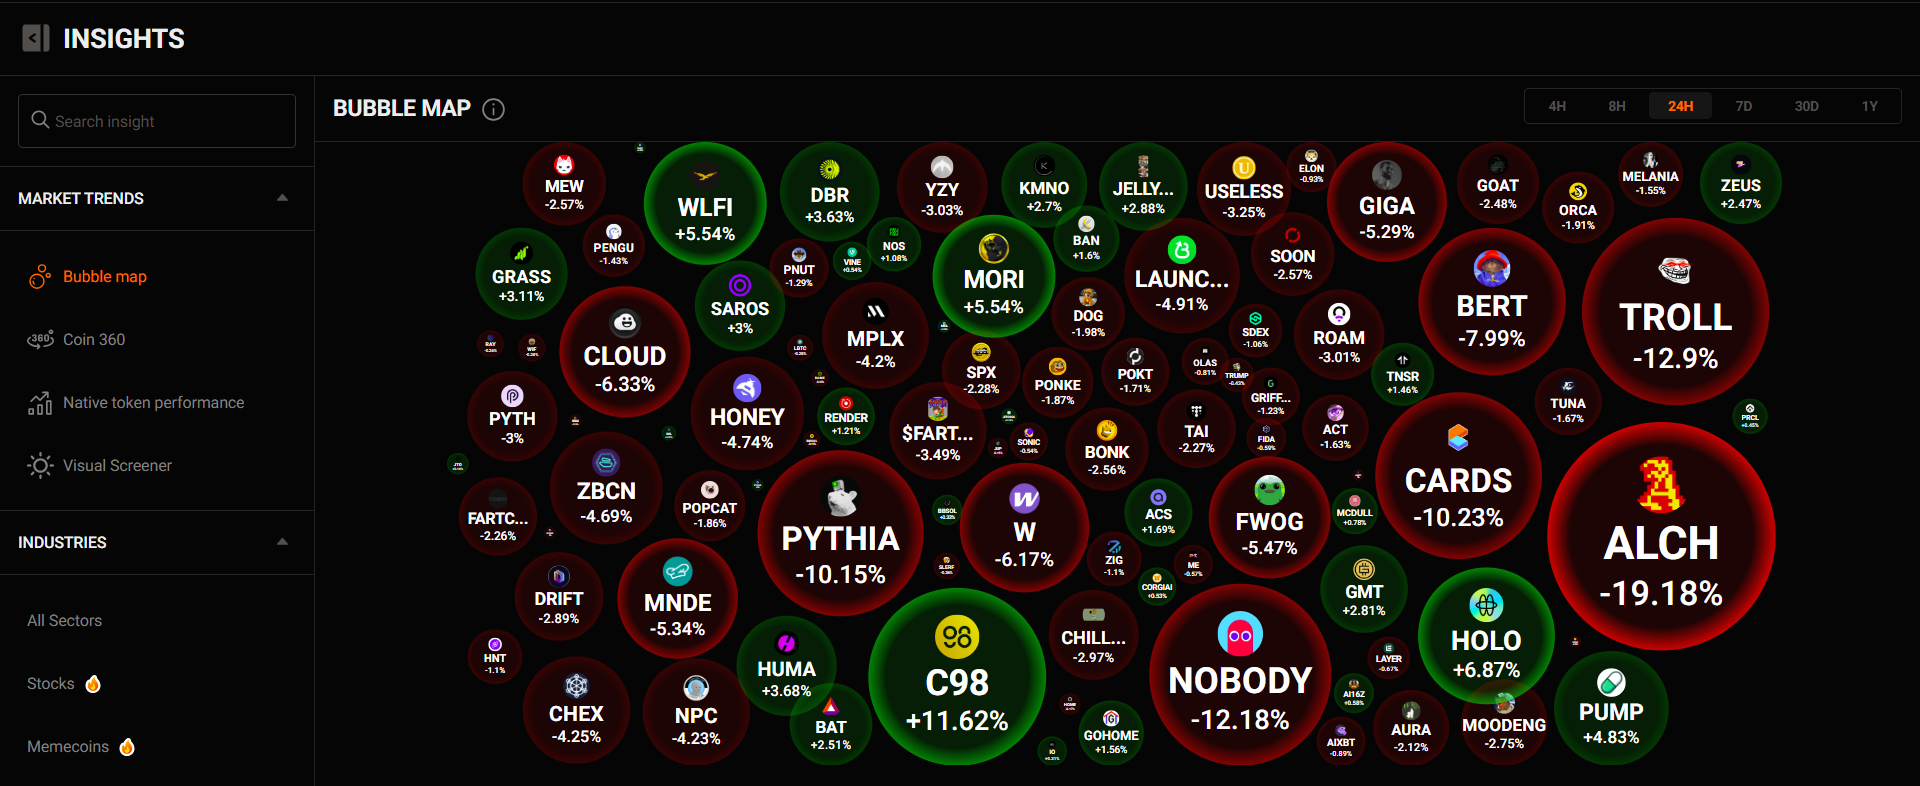
[2] Bubble map
The bubble chart gives a visual snapshot of token price movements, helping you quickly identify which coins have gained or lost the most within different timeframes (in this example, 24H).
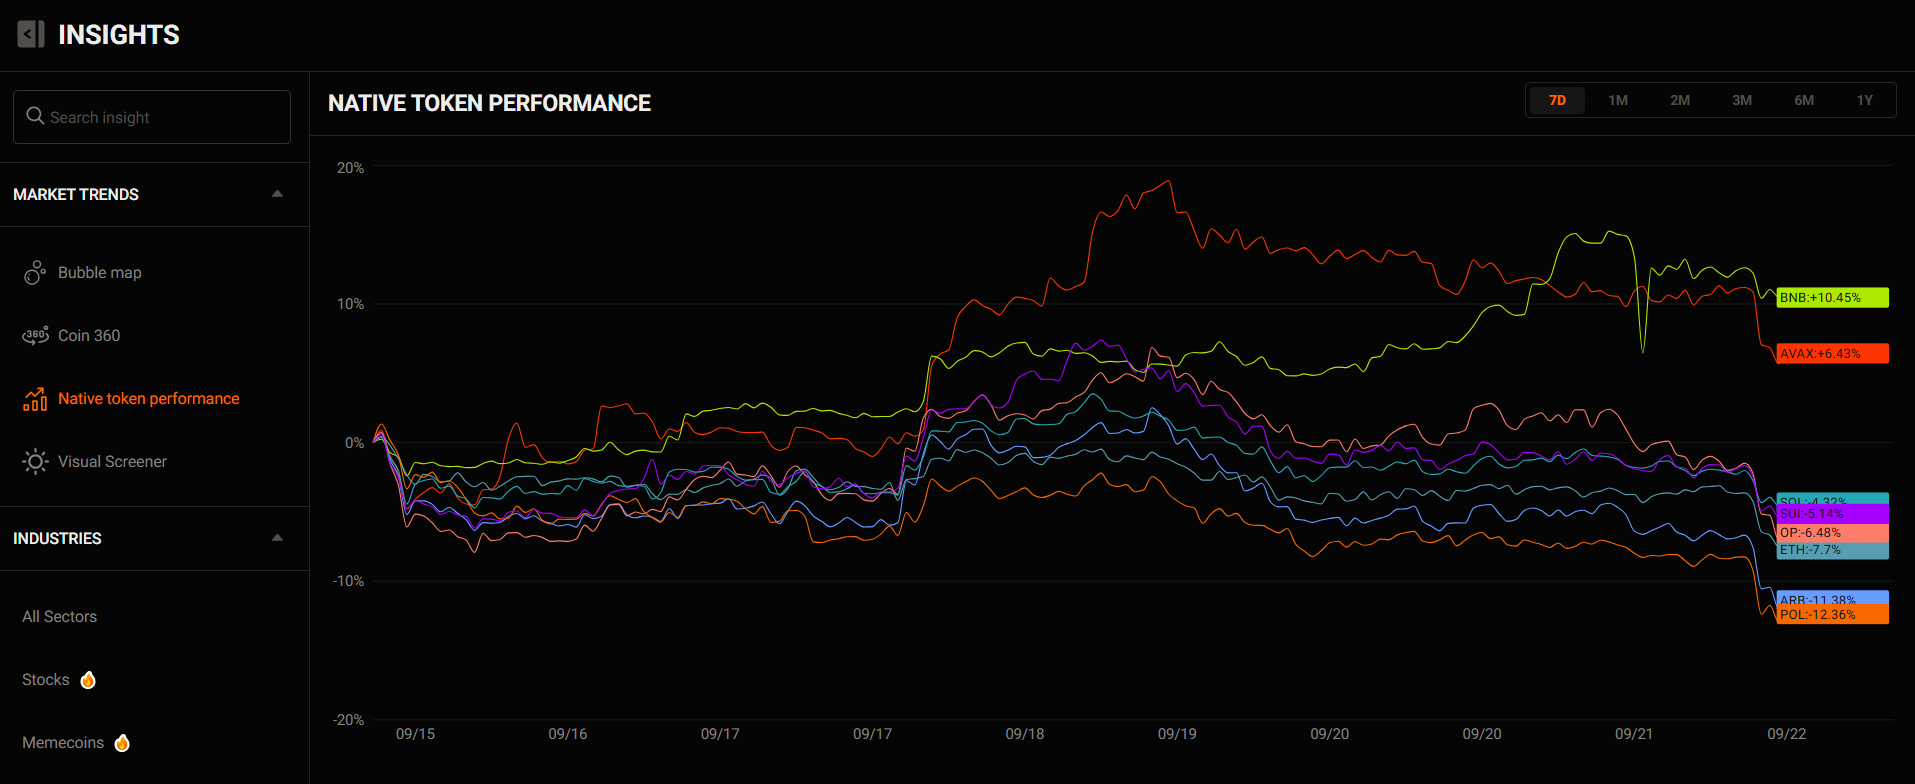
[3] Native token performance
This chart shows the percentage change in the prices of native tokens such as BNB, AVAX, and SOL over time. It allows you to easily compare which blockchain ecosystems are strengthening or weakening within a given period (here, 7D - but you can switch to 1M, 2M,...).
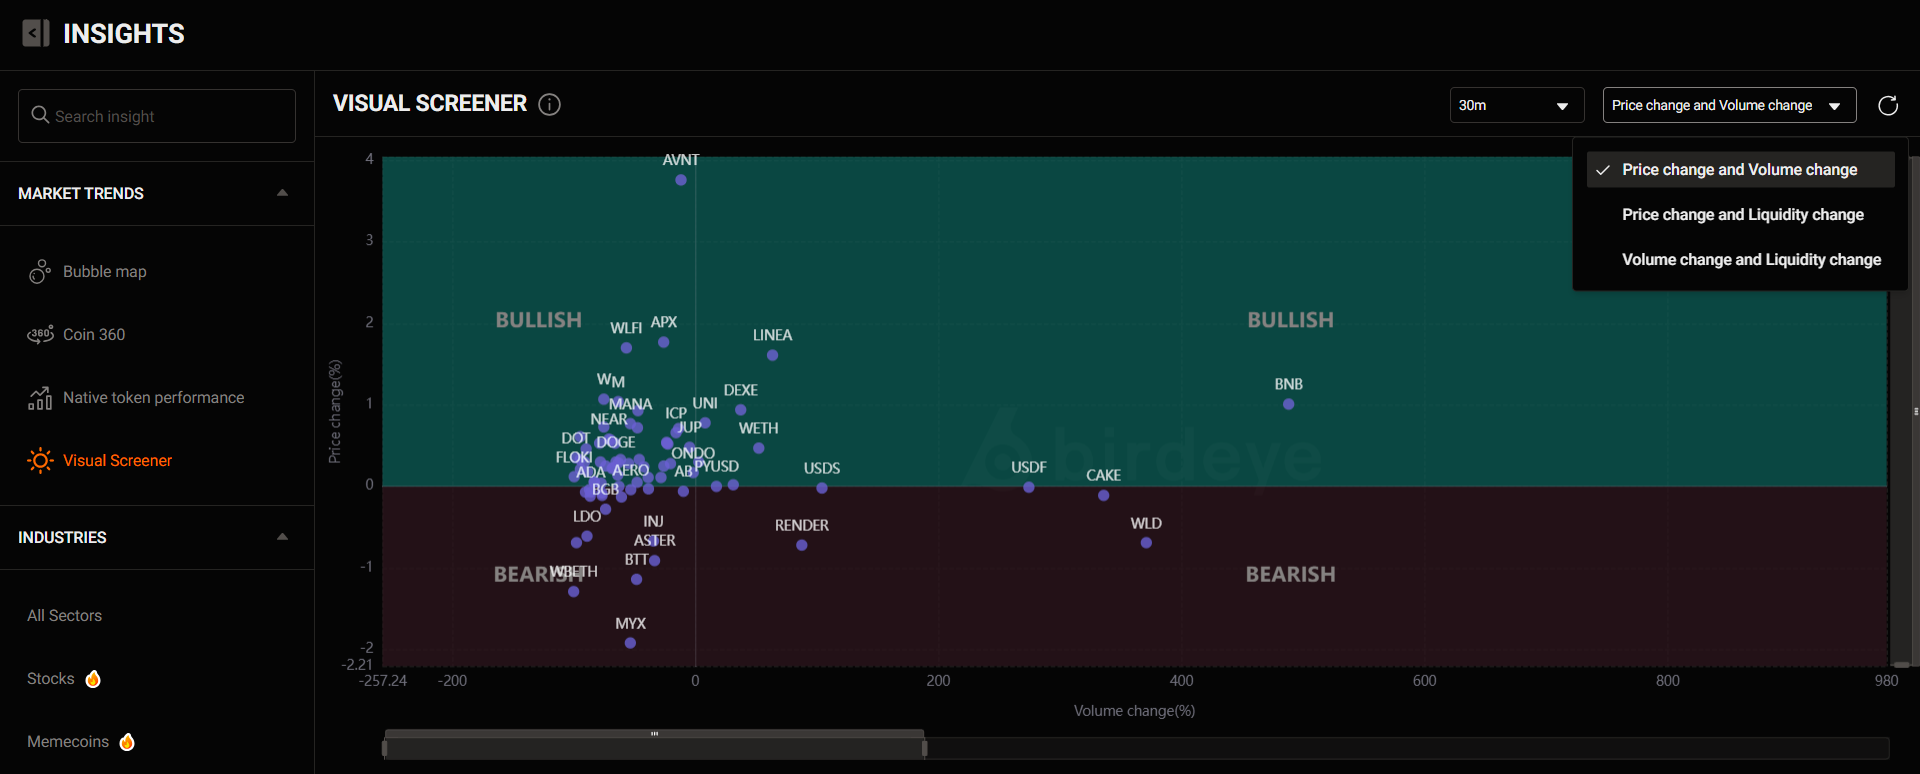
[4] Visual screener
The Visual Screener chart displays price change (%) on the vertical axis and trading volume change (%) on the horizontal axis over different timeframes (here, the past 30 minutes). This helps you quickly spot which tokens are seeing strong buying momentum (Bullish) and which are under selling pressure (Bearish) within the timeframe you’ve set.
To get a clearer view of the market trend, move on to Step 2.
Step 2: Track sector rotation
Capital is not created or destroyed; it's an art of capital rotation. This means that when the capital flowing into BTC slows down, it can shift strongly into another group, such as DeFi, Layer 1, or Memecoins.
Understanding where capital is rotating helps you to:
- Avoid buying tokens in sectors that have already peaked
- Catch the next trending group of tokens early
To start, click here (Insight) or go to ‘Explore’ ⇒ ‘Insight’ ⇒ ‘All sectors’.
Here you will find charts that provide a clear view of market trends.
[1] Sector Heatmap
The Heat Map gives you a quick overview of the entire crypto market's performance by sector, based on market cap, 24h volume, and liquidity.
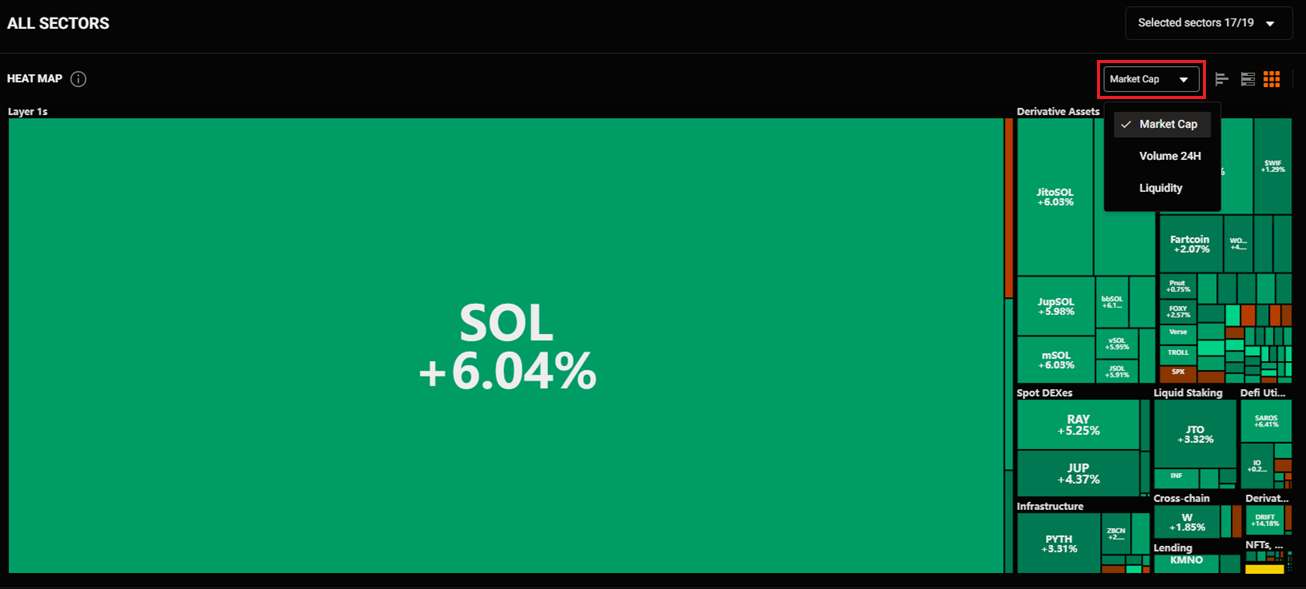
To get a better view of token price fluctuations within each sector, you could also use two other chart types:
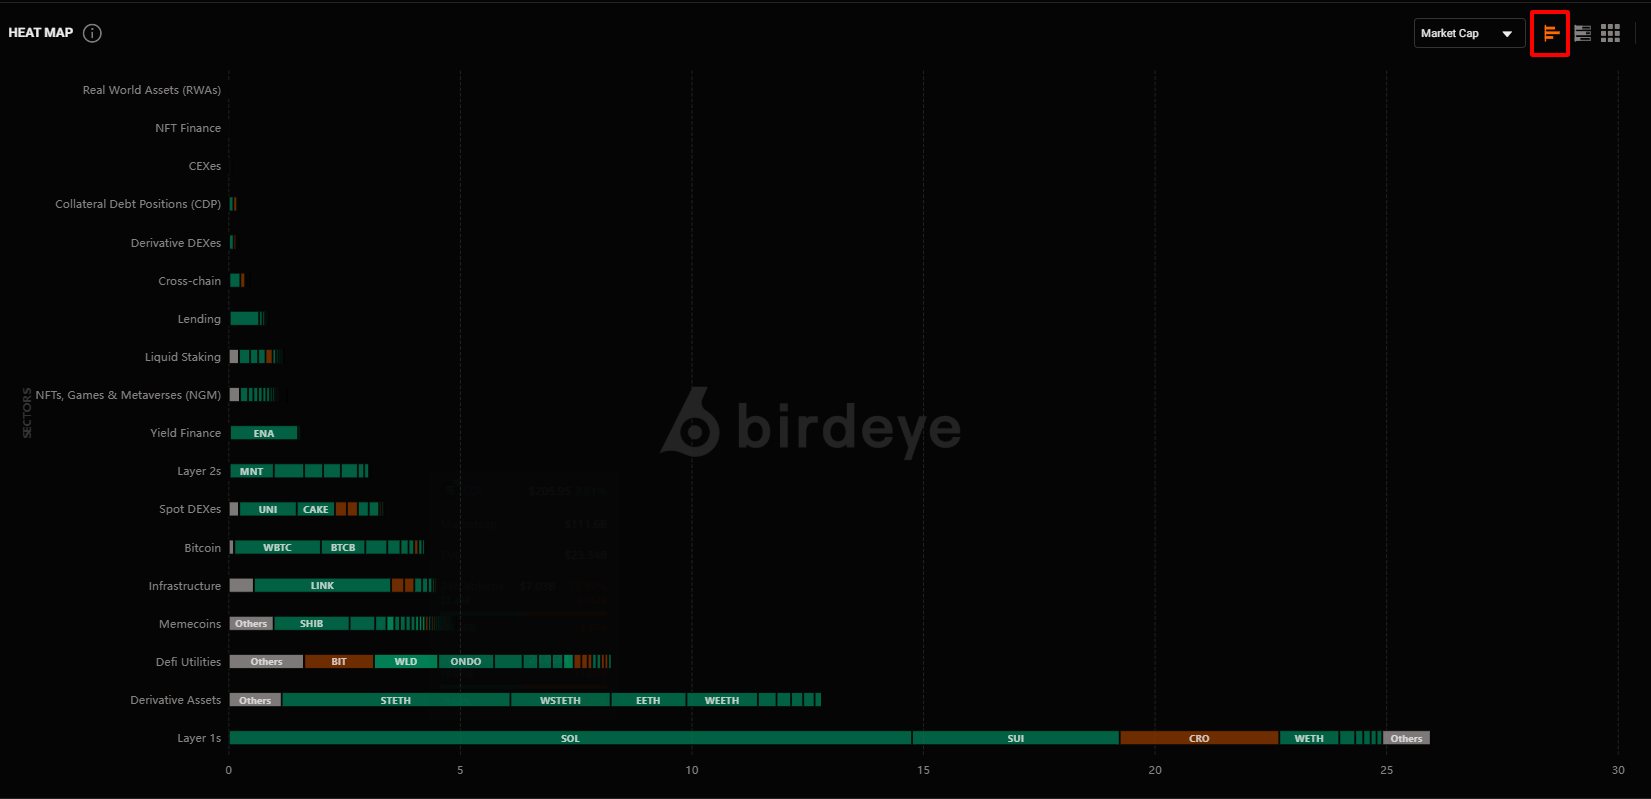
Type 1: Helps you compare different sectors.
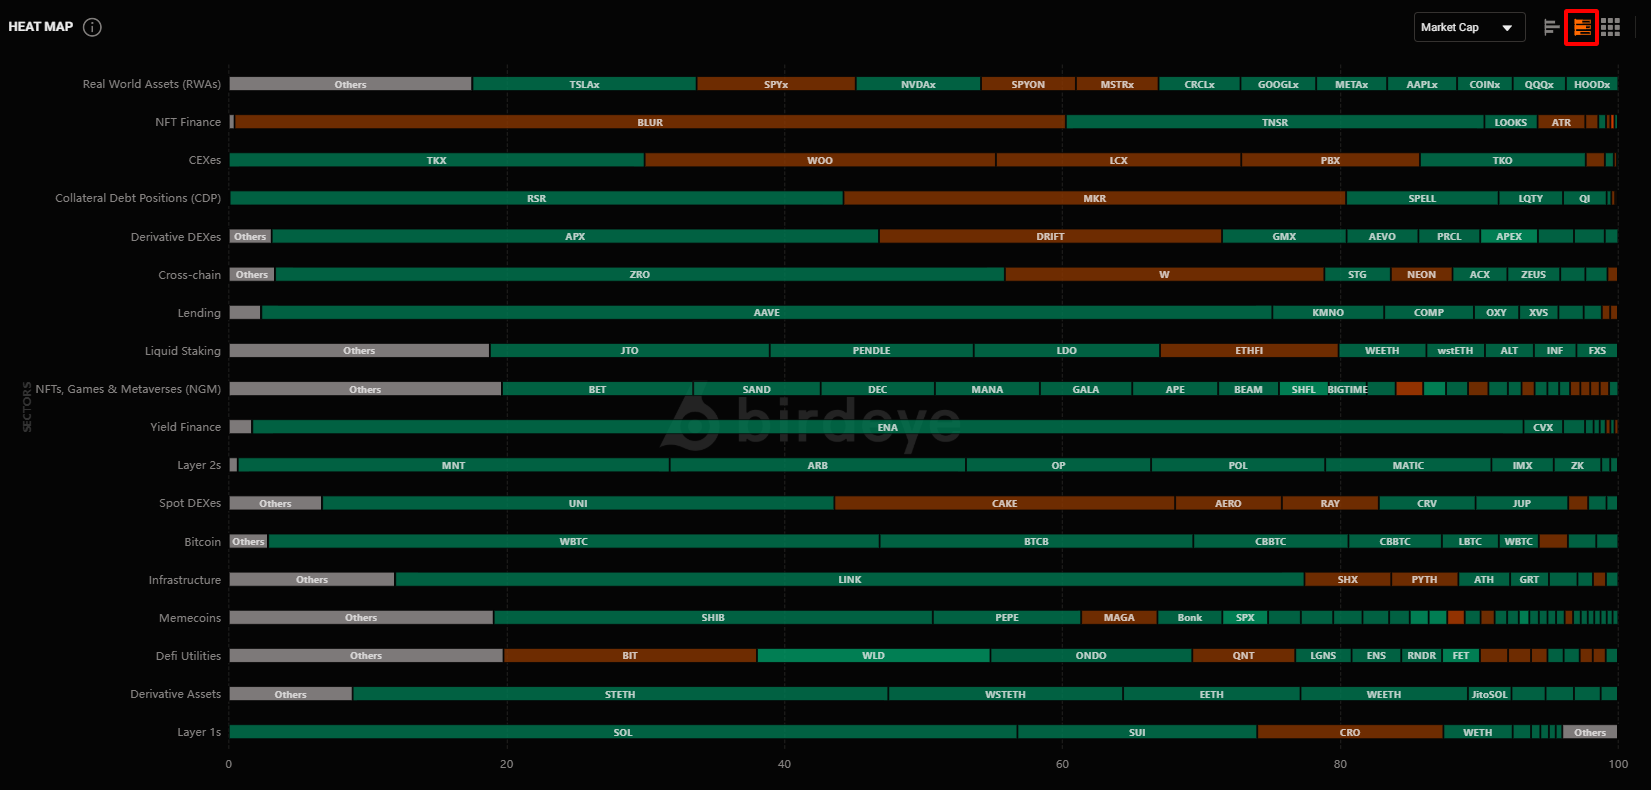
Type 2: Helps you compare individual tokens within a sector.
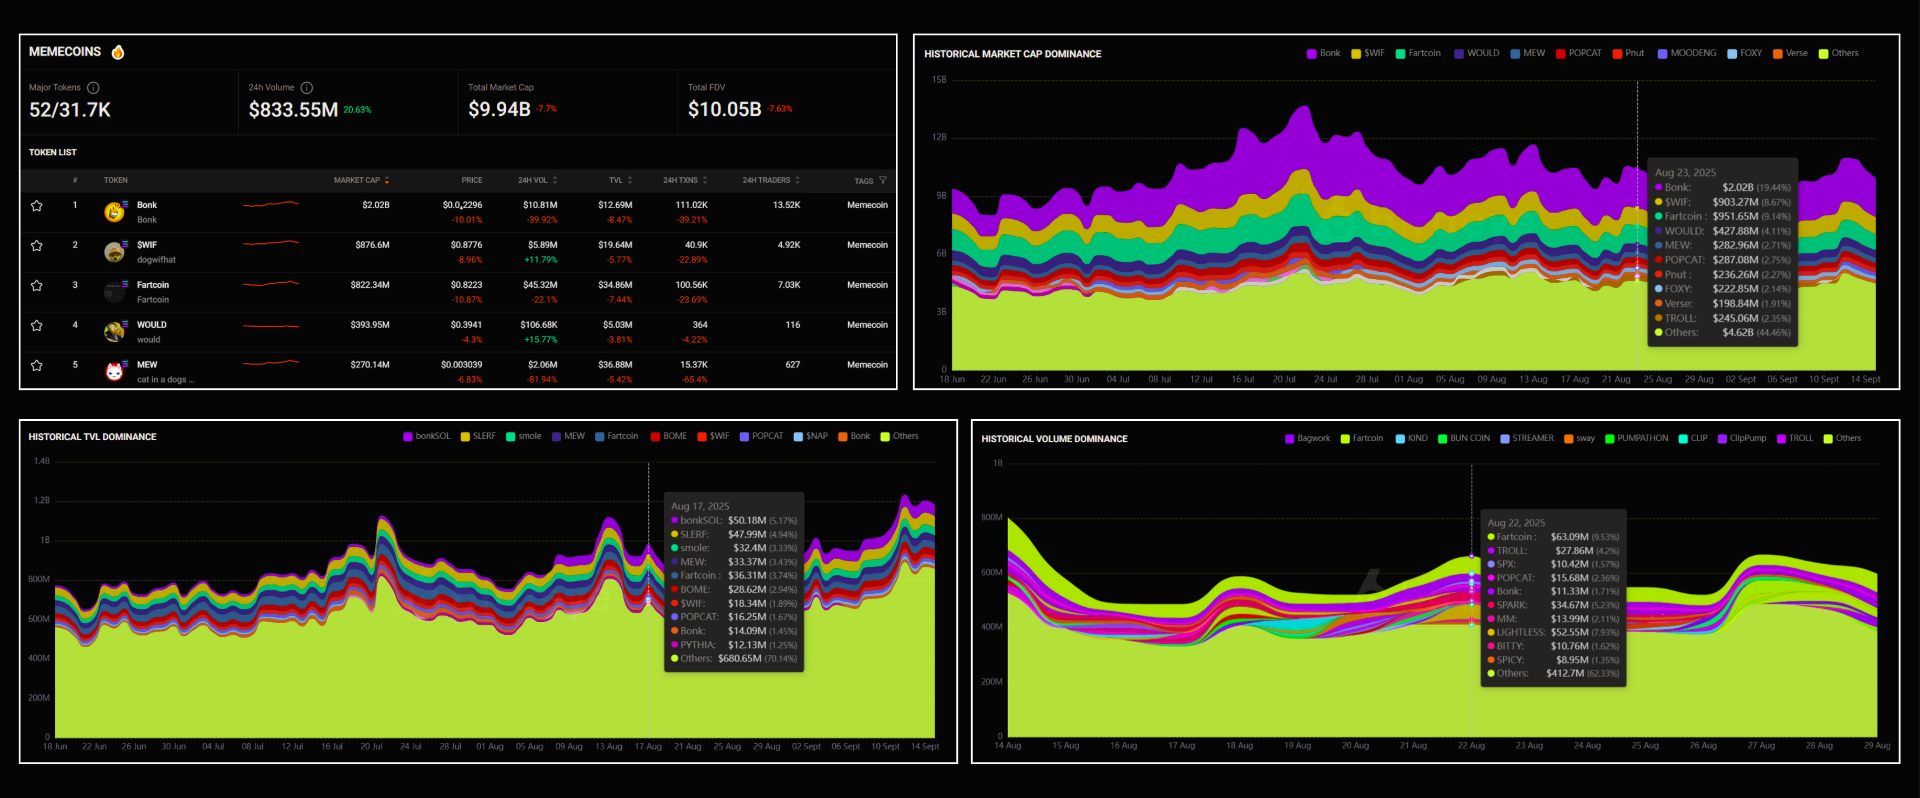
[2] Historical sector dominance
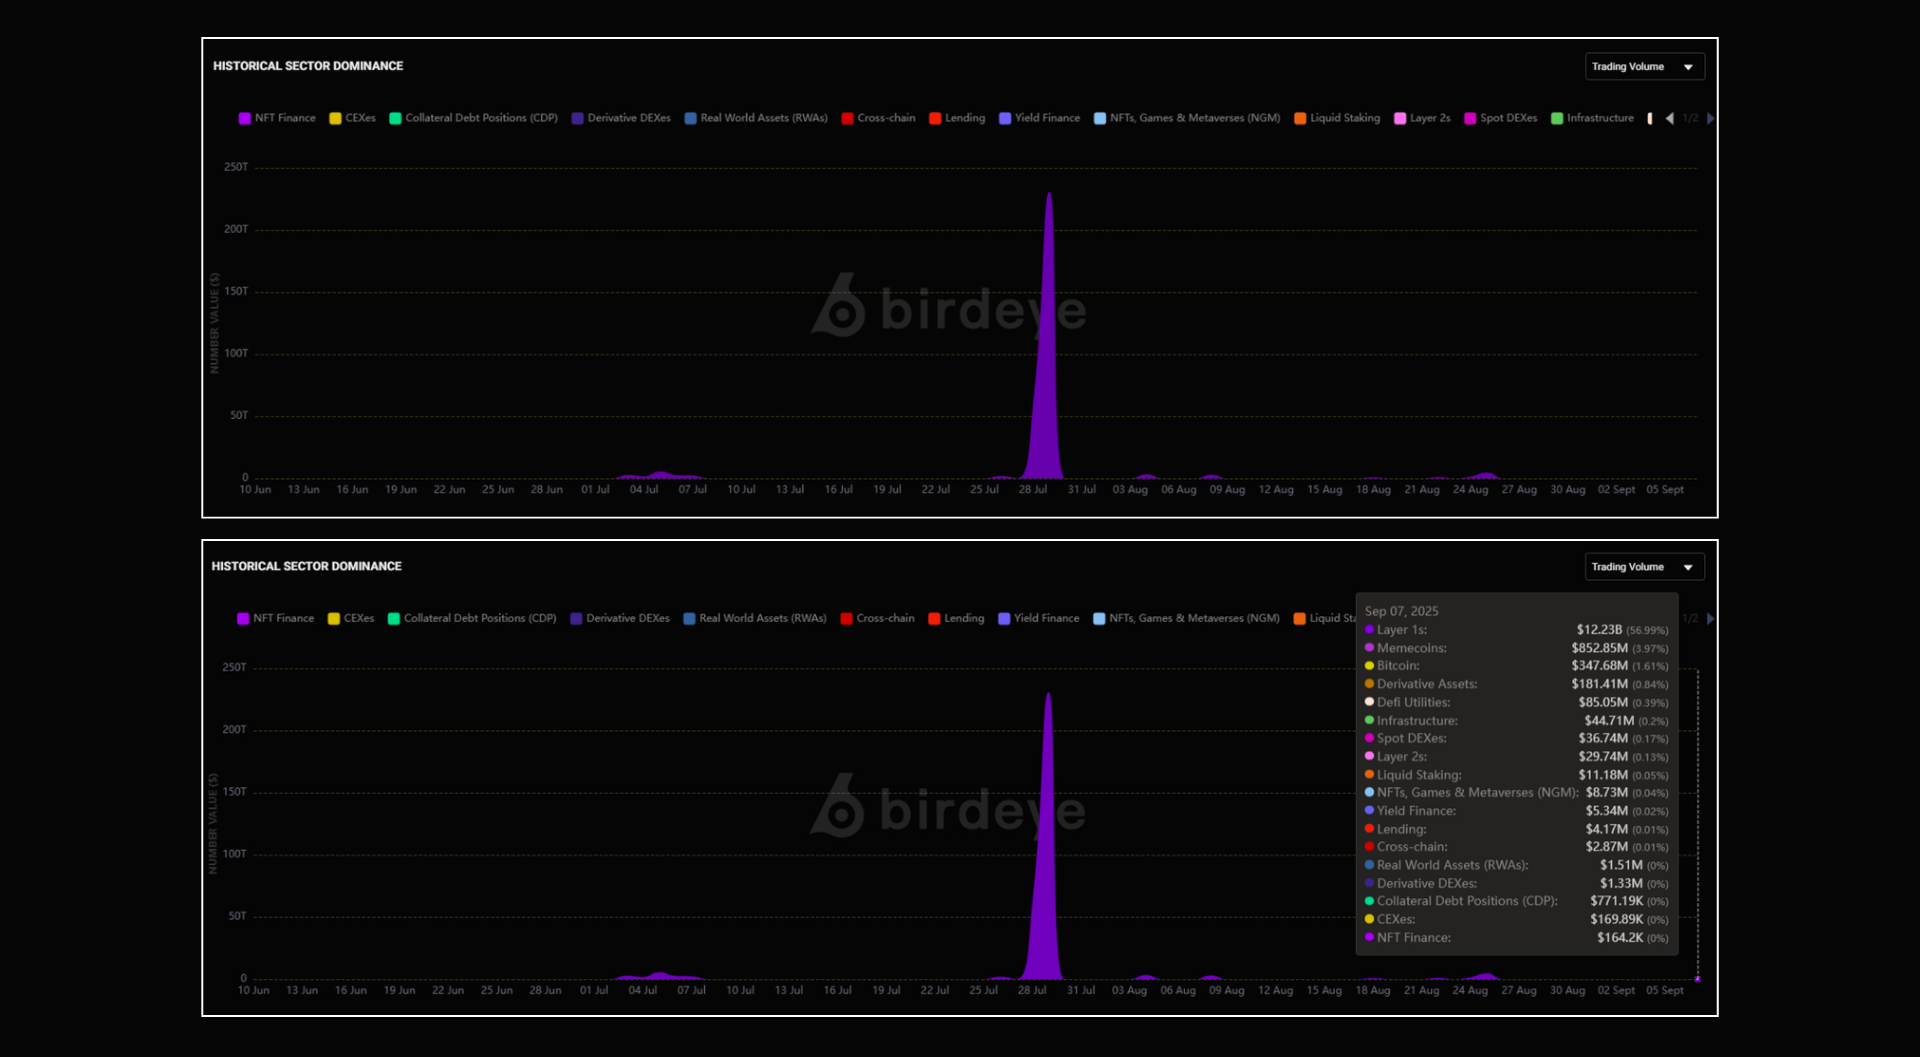
This chart shows the total buy and sell volume over a period, telling you which sector is being traded the most.
For example, on July 9, 2025, Layer 1s accounted for over 56% of the trading volume, which was approximately $12.23B.
[3] Sector Index
A Sector Index is a composite metric that measures the overall performance of a group of tokens (a sector).
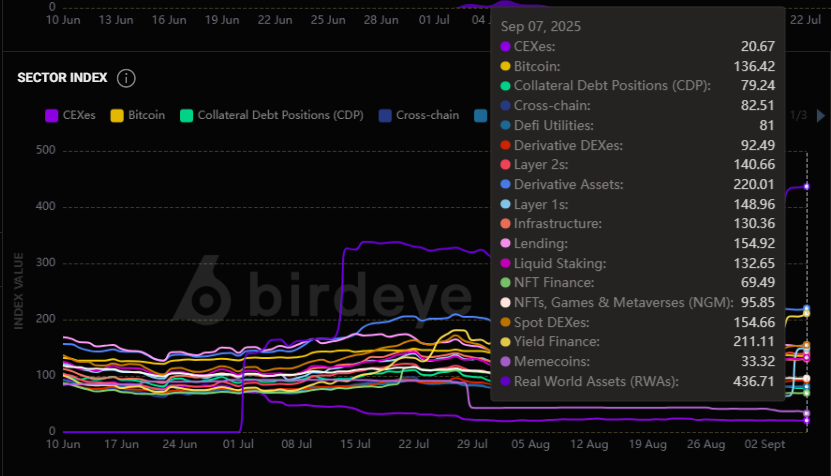
Reading this chart allows you to quickly compare the performance of one sector against others to see where capital is flowing and to gauge the strength and durability of that trend.
[4] Price performance by sector
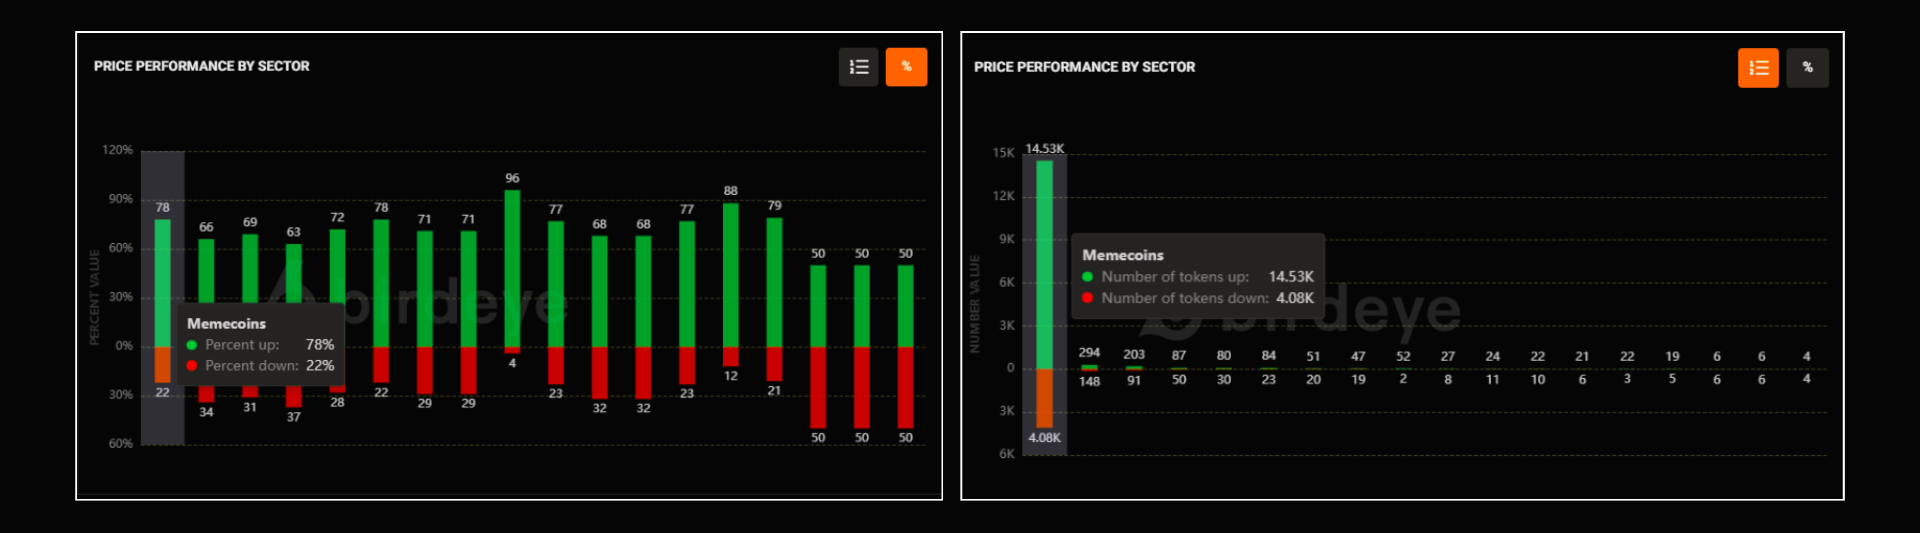
This is a visual chart that shows how many tokens within each sector have risen or fallen in price, along with the percentage change for each token.
[5] Performance Table
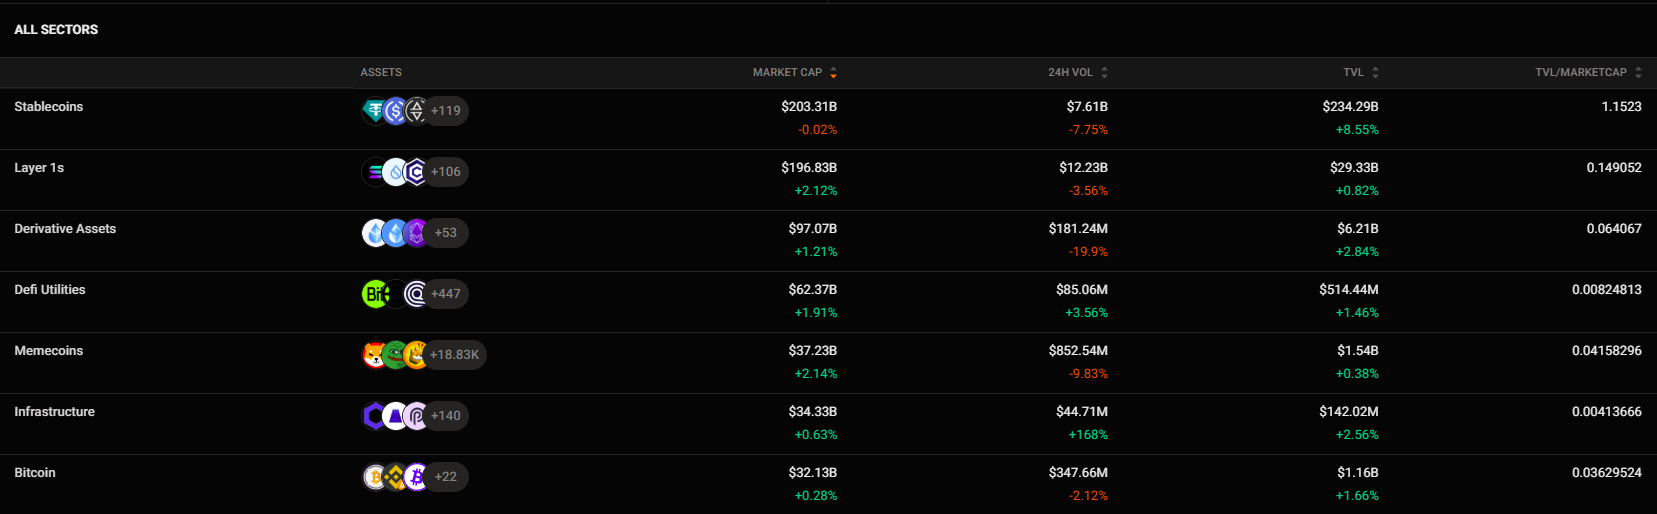
Here, you will find a list of all the current sectors in the market. Looking at this gives you a general overview of each one's status. If you want to learn more detail, just click on a specific sector.
You will find:
- A list of all the tokens in that sector
- Quick glance stats of the sector performance
- A few charts to help you quickly assess the top tokens' performance
Bottom Line
To become a smart investor in the crypto market, you need to see beyond short-term price swings. By using market analysis tools like Coin 360 and Insight, you can grasp the big picture, track where money is flowing, and identify potential trends.
Only when you understand the overall landscape can you make sound investment decisions, maximize profits, and mitigate risks.
Updated 4 months ago