
Cohort Overview
Cohort Overview is the perfect feature if you want to understand the market through groups of Smart Traders, instead of analyzing individual wallets.
It helps you:
- Identify where different trader groups are positioning
- Understand market sentiment across cohorts
- Gain insights faster with aggregated behavior
How to use this feature?
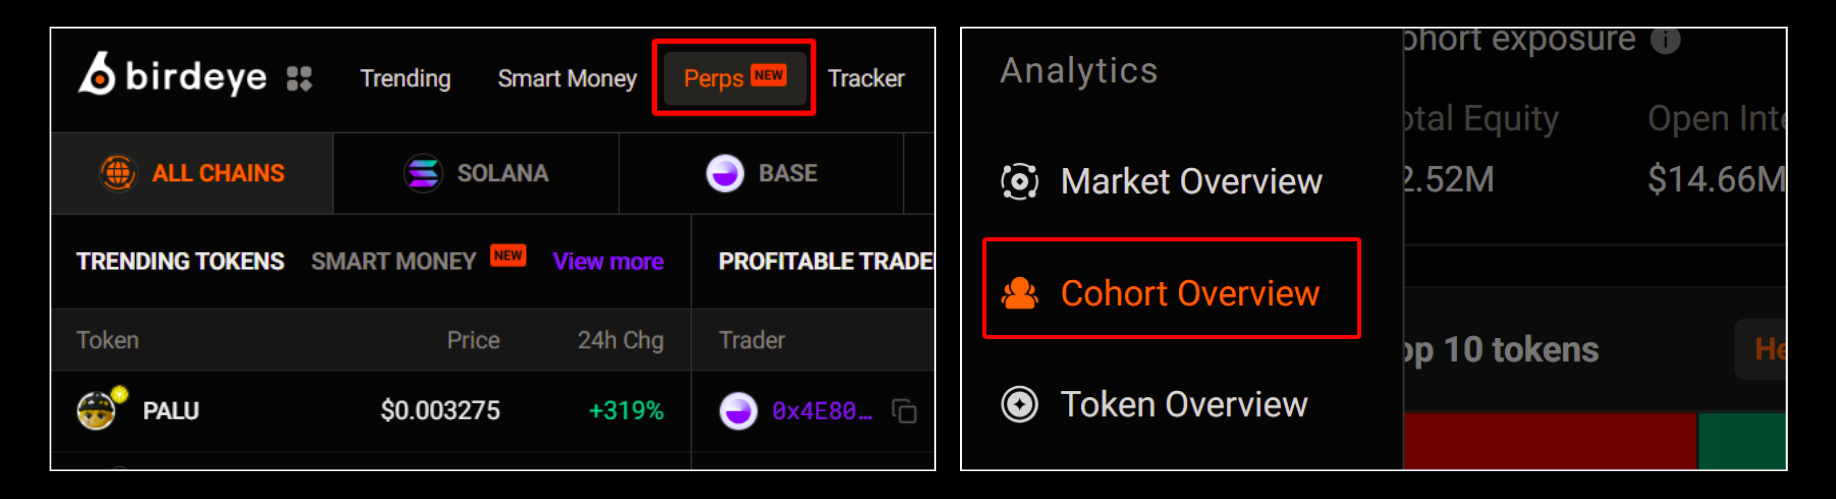
To start, click here (Cohort Overview) or go to ‘Perps’ → ‘Cohort Overview’.
To use this feature effectively, focus on 3 key areas:
- Filtered by win rate, PnL performance, and capital size
- Filtered by Position age
- Understand the Data Panels
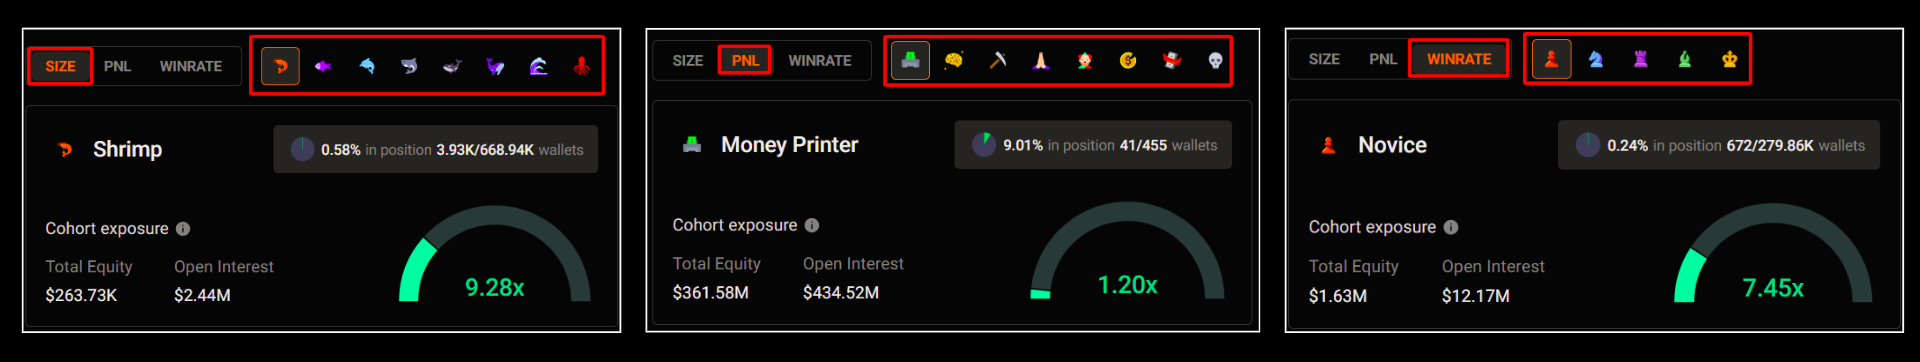
[1] Filtered by win rate, PnL performance, and capital size
This filter allows you to group traders into cohorts based on Winrate (skill level), PnL performance (profitability), Capital size (wallet size: shrimp, fish, whale, etc.),
With it, you can instantly spot insights at a glance:
- Overall market exposure across different tokens
- Clear directional bias (long/short) for each specific cohort
- Defined sentiment on individual tokens so you can catch the rotation
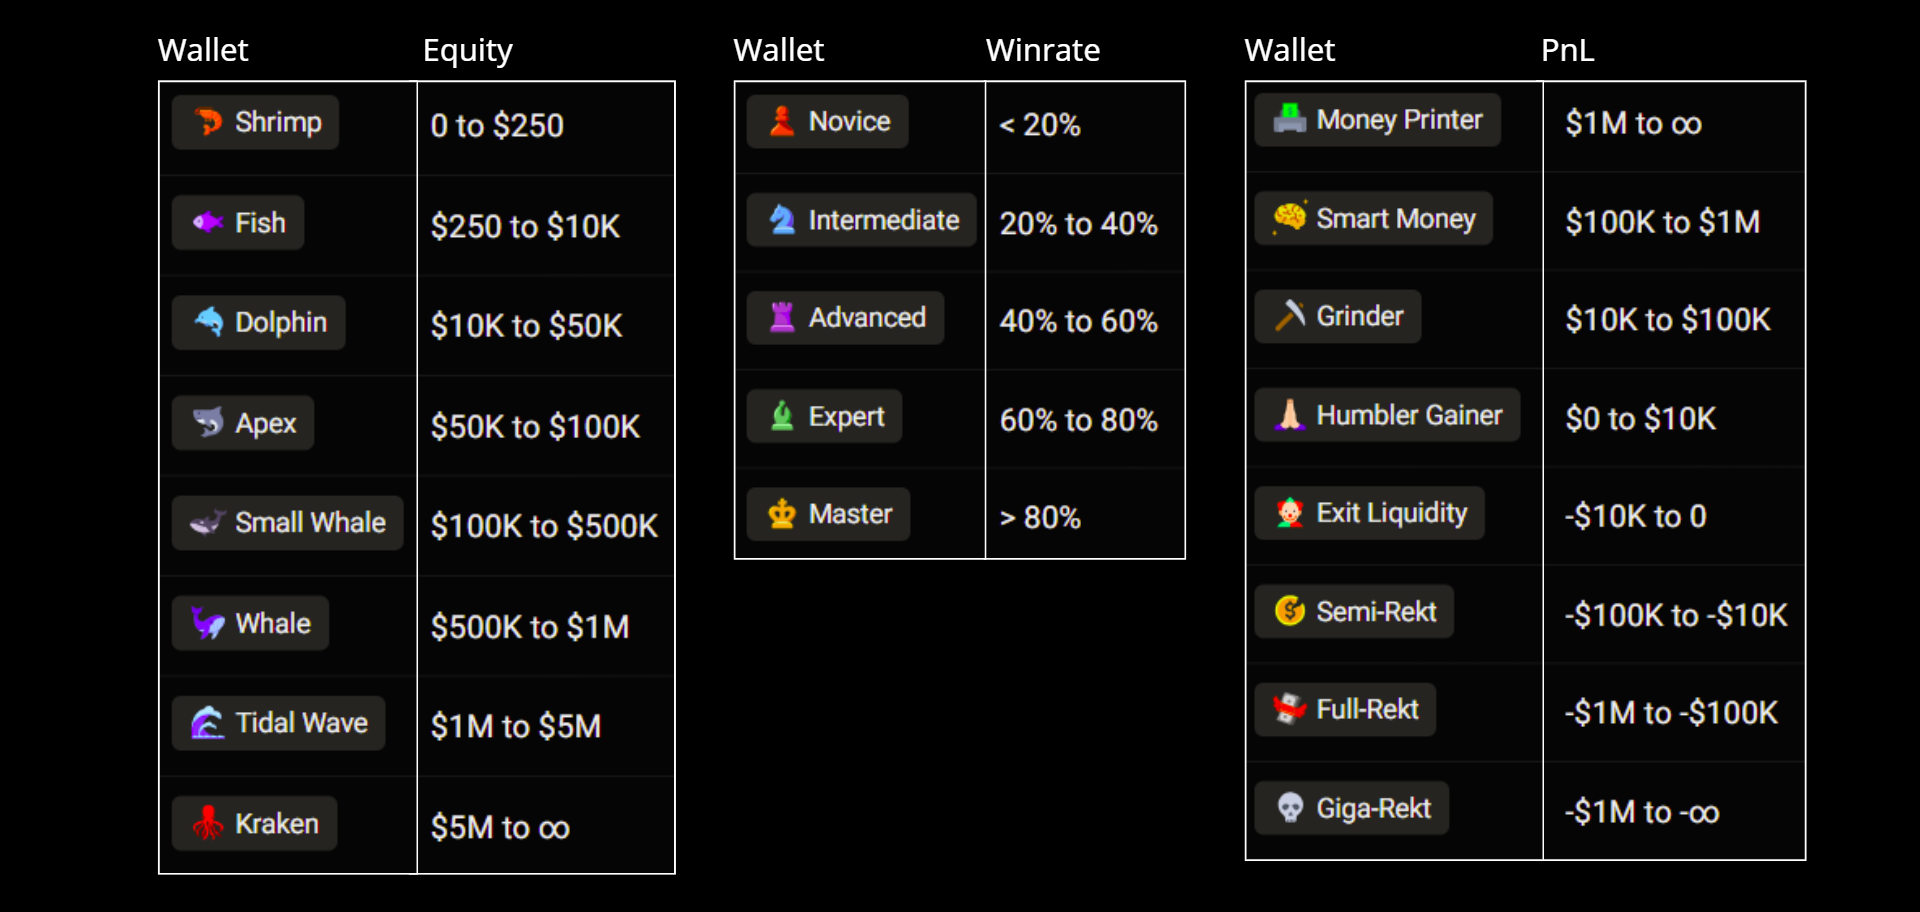
To fully understand this section, make sure you read the cohort icons, as each icon represents a specific trader group and behavior profile.
[2] Filtered by Position age
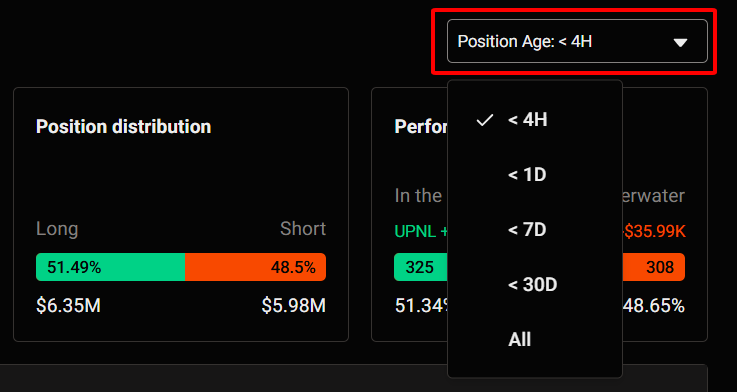
This filter lets you analyze positions based on how long they’ve been open. And it works together with [1], this helps you understand:
- Timing of entries
- Whether a trend is new or already crowded
[3] Understand the Data Panels
Once filters are applied, you’ll see 3 main sections:
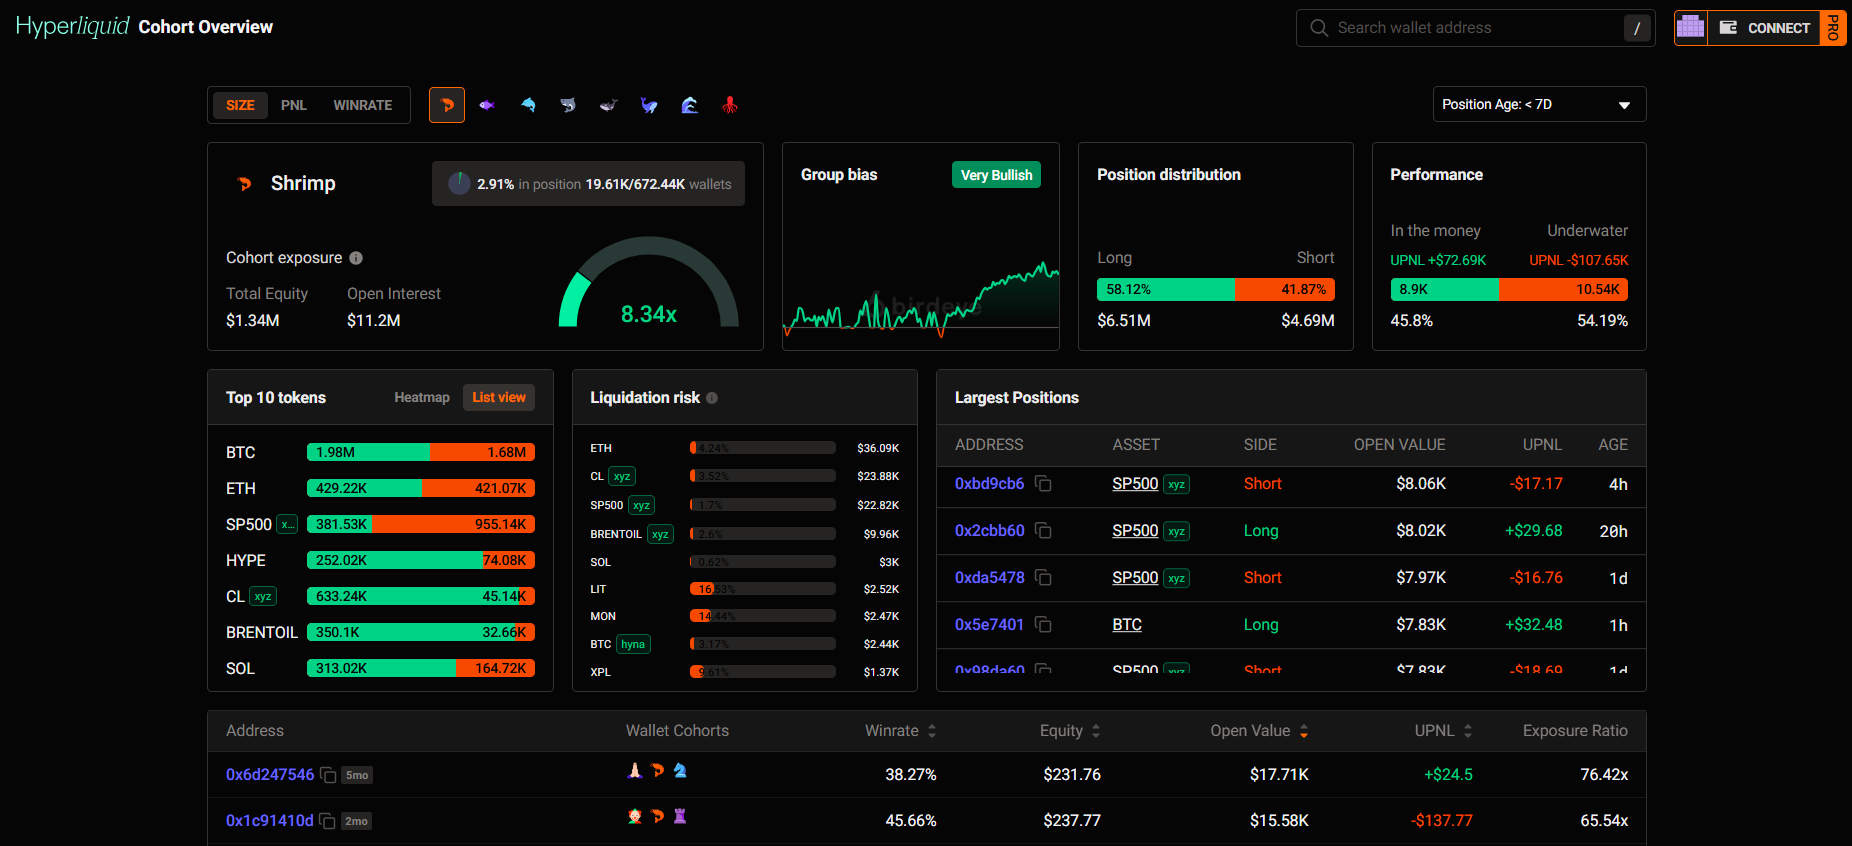
#1: Overview
Here, you get a quick snapshot of a cohort.
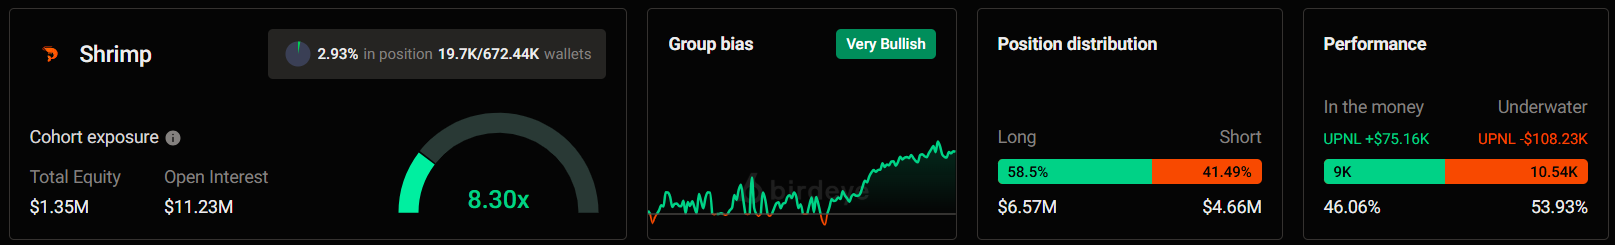
Example insights:
- Shrimp cohort (equity: 0 to $250) is Very Bullish with 58.8% is long and exposure of 8.26x
- 2.93% in position 19.7K/672.44K wallets
- Performance: Loss
#2 Detail
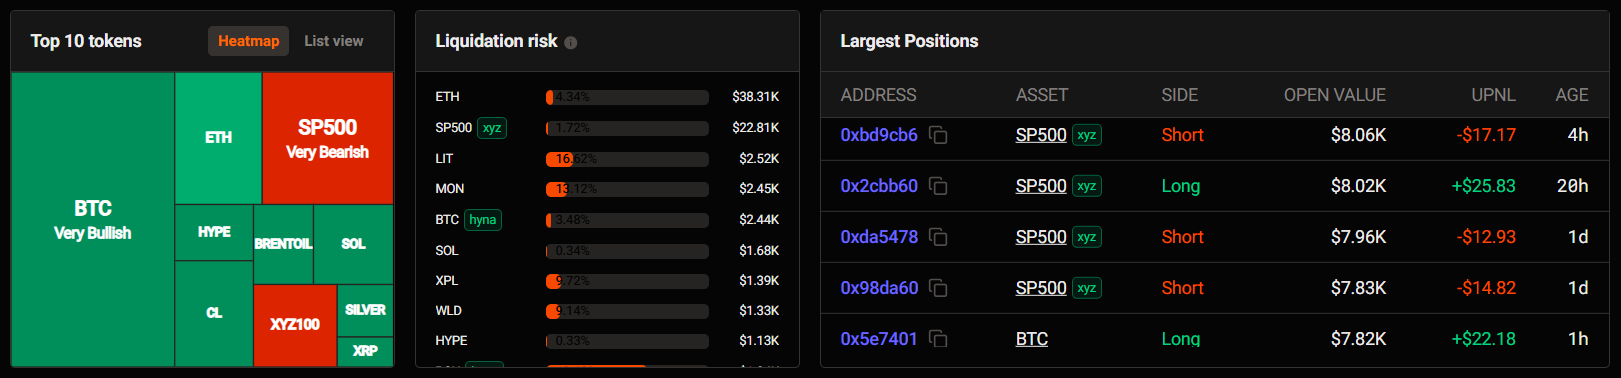
This section gives you deeper insights into what the cohort is doing:
- Top 10 tokens the cohort is opening positions in
- Liquidation risk
- Opened largest positions and which tokens they focus on
#3 Top wallet
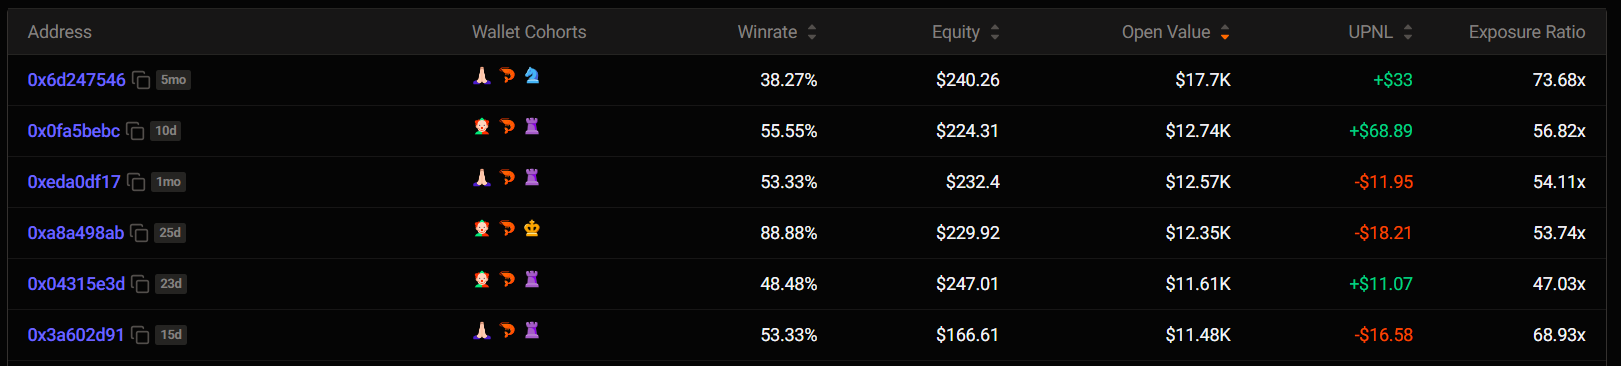
You’ll need:
Updated about 2 months ago